0 Results for ""

Know where capital is being deployed
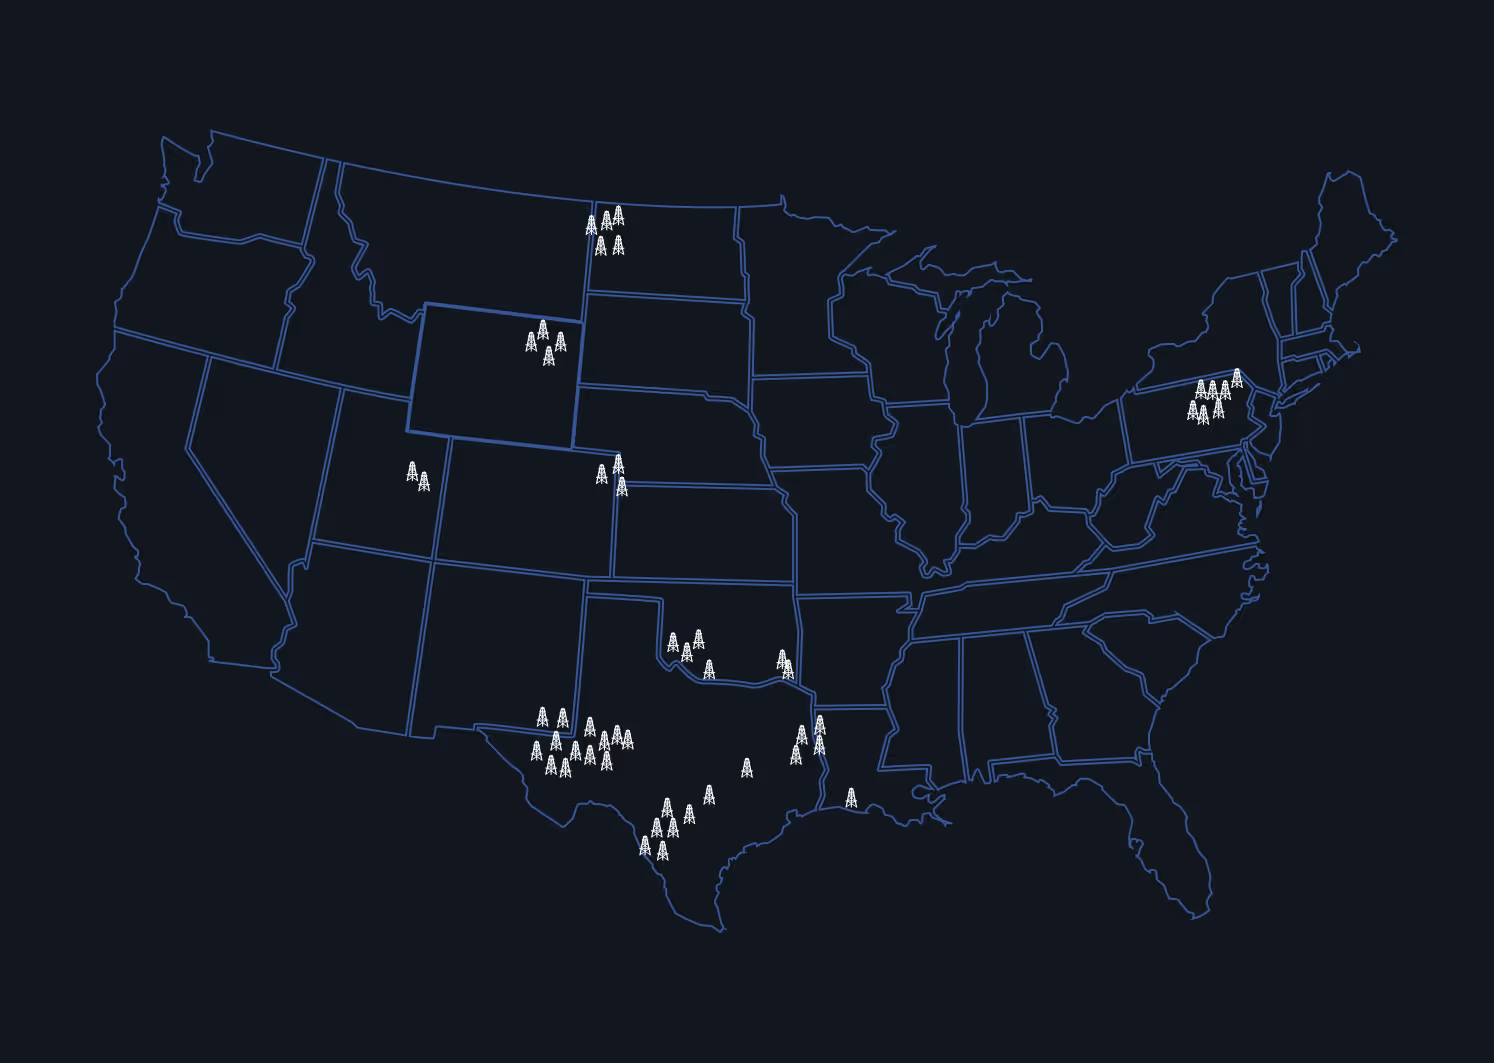
Rig location intelligence tells you where operators are committing capital today. Energy Domain tracks rig positions daily using a multi-source methodology that combines direct contractor reporting with satellite imagery verification.
Trusted by operators, non-op buyers, mineral aggregators, and A&D advisors across the upstream market.






Why It Matters
Rig activity is a leading indicator of capital commitment. For land teams monitoring competitive activity, acquirers evaluating development potential, and engineers tracking offset operators, rig location data is foundational intelligence. It tells you who is drilling, where, and how actively — well before production data or even permit filings reveal the full picture.
The challenge is accuracy and timeliness. Stale rig data, incomplete coverage, or delayed reporting creates blind spots. Our approach closes those gaps through a dual-source methodology designed for daily precision.
Dual-Source Rig Position Capture
Energy Domain acquired a rig data business to build this capability from the ground up. Rig positions are sourced through two complementary channels.
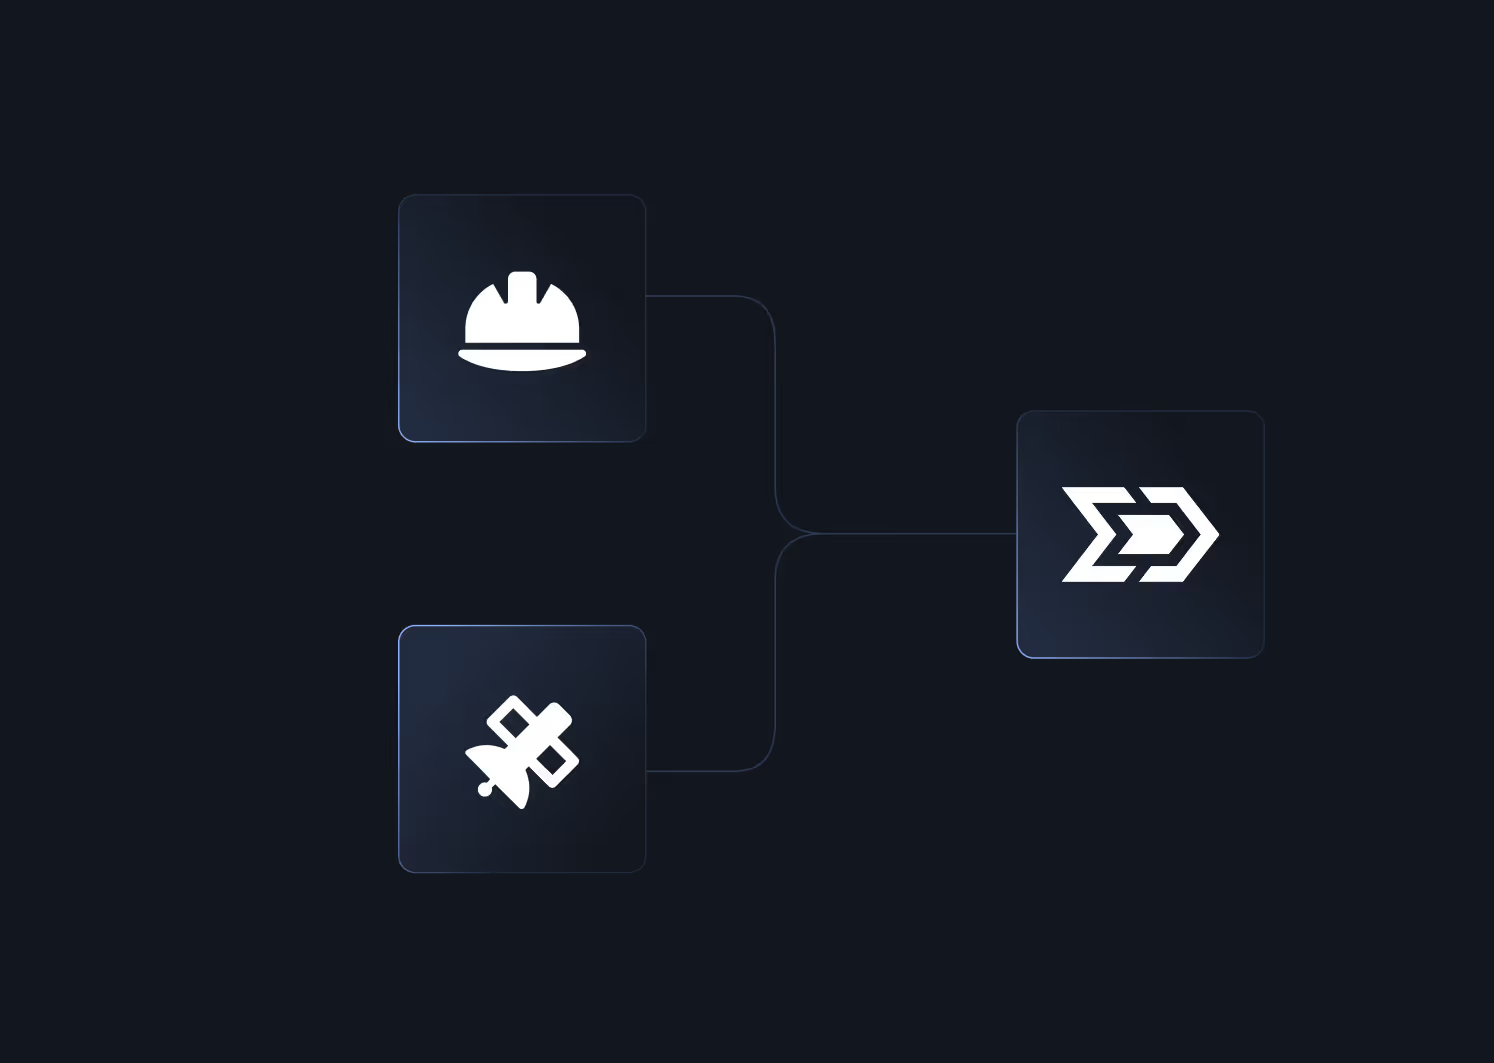
~65% Direct from Drilling Contractors: The majority of rig positions come directly from the drilling contractors themselves. These are first-party reports of active rig locations — the most authoritative source available.
~35% Satellite Imagery: The remaining rig positions are captured via satellite imagery. This fills the gap where contractor reporting is unavailable, ensuring comprehensive national coverage regardless of reporting relationships.
94–99% Coverage vs. Baker Hughes: Depending on the day, coverage hovers between 94% and 99% compared to the Baker Hughes rig count — the industry benchmark.
Rig positions are updated daily across the national footprint. In some cases, updates occur intraday — capturing rig moves, spud events, and mobilization as they happen rather than at end-of-day reporting intervals.
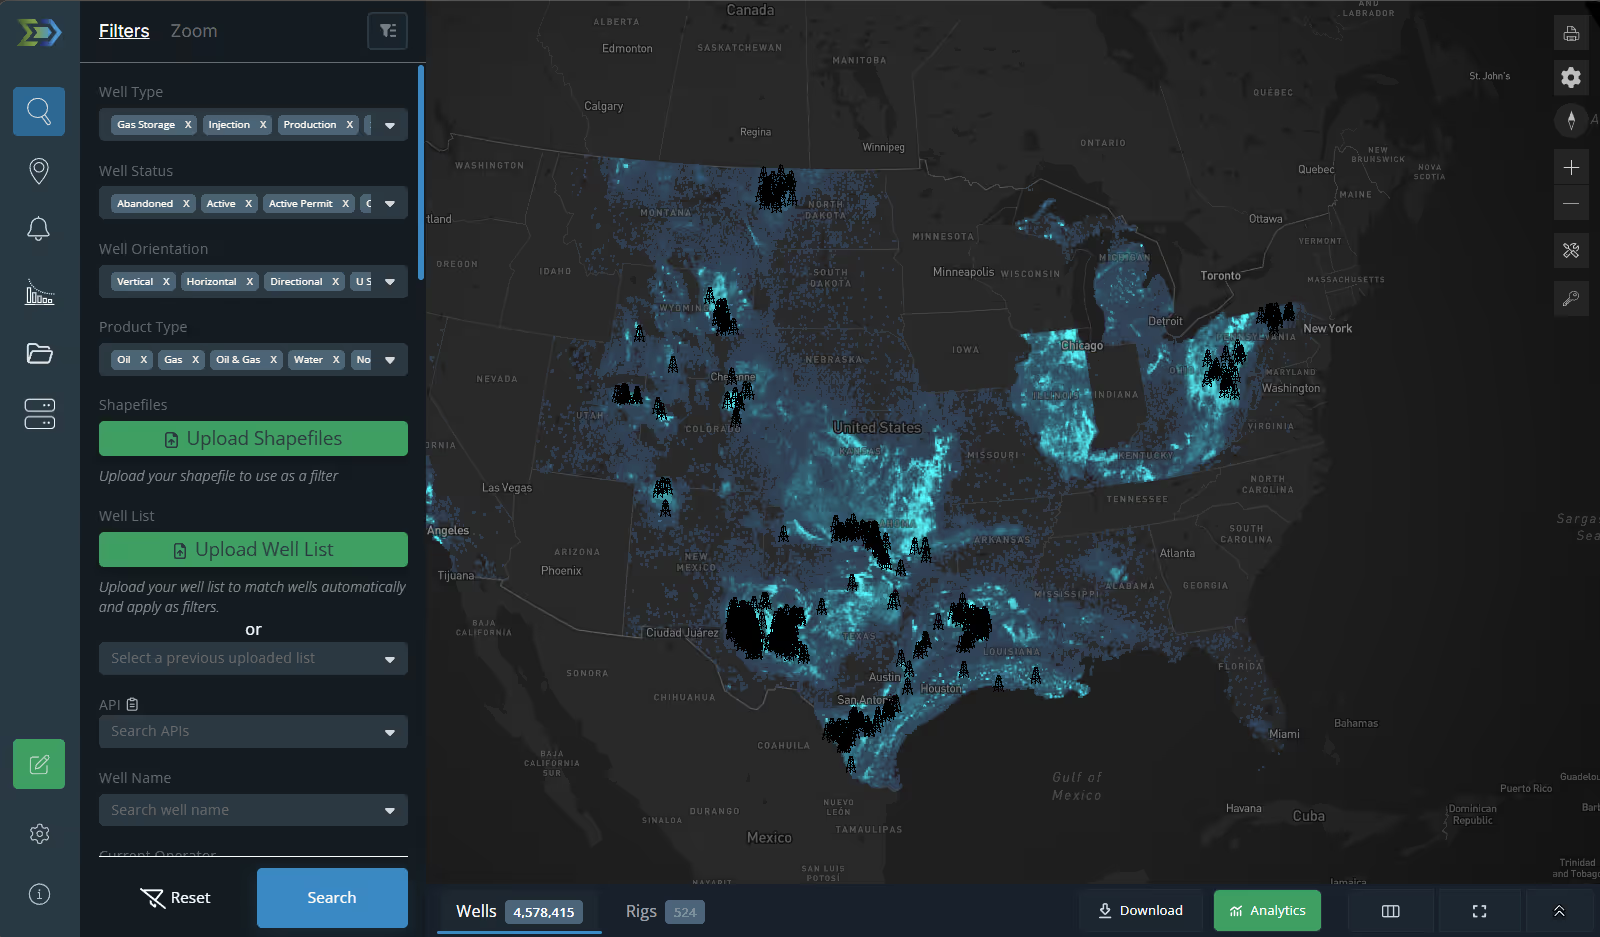
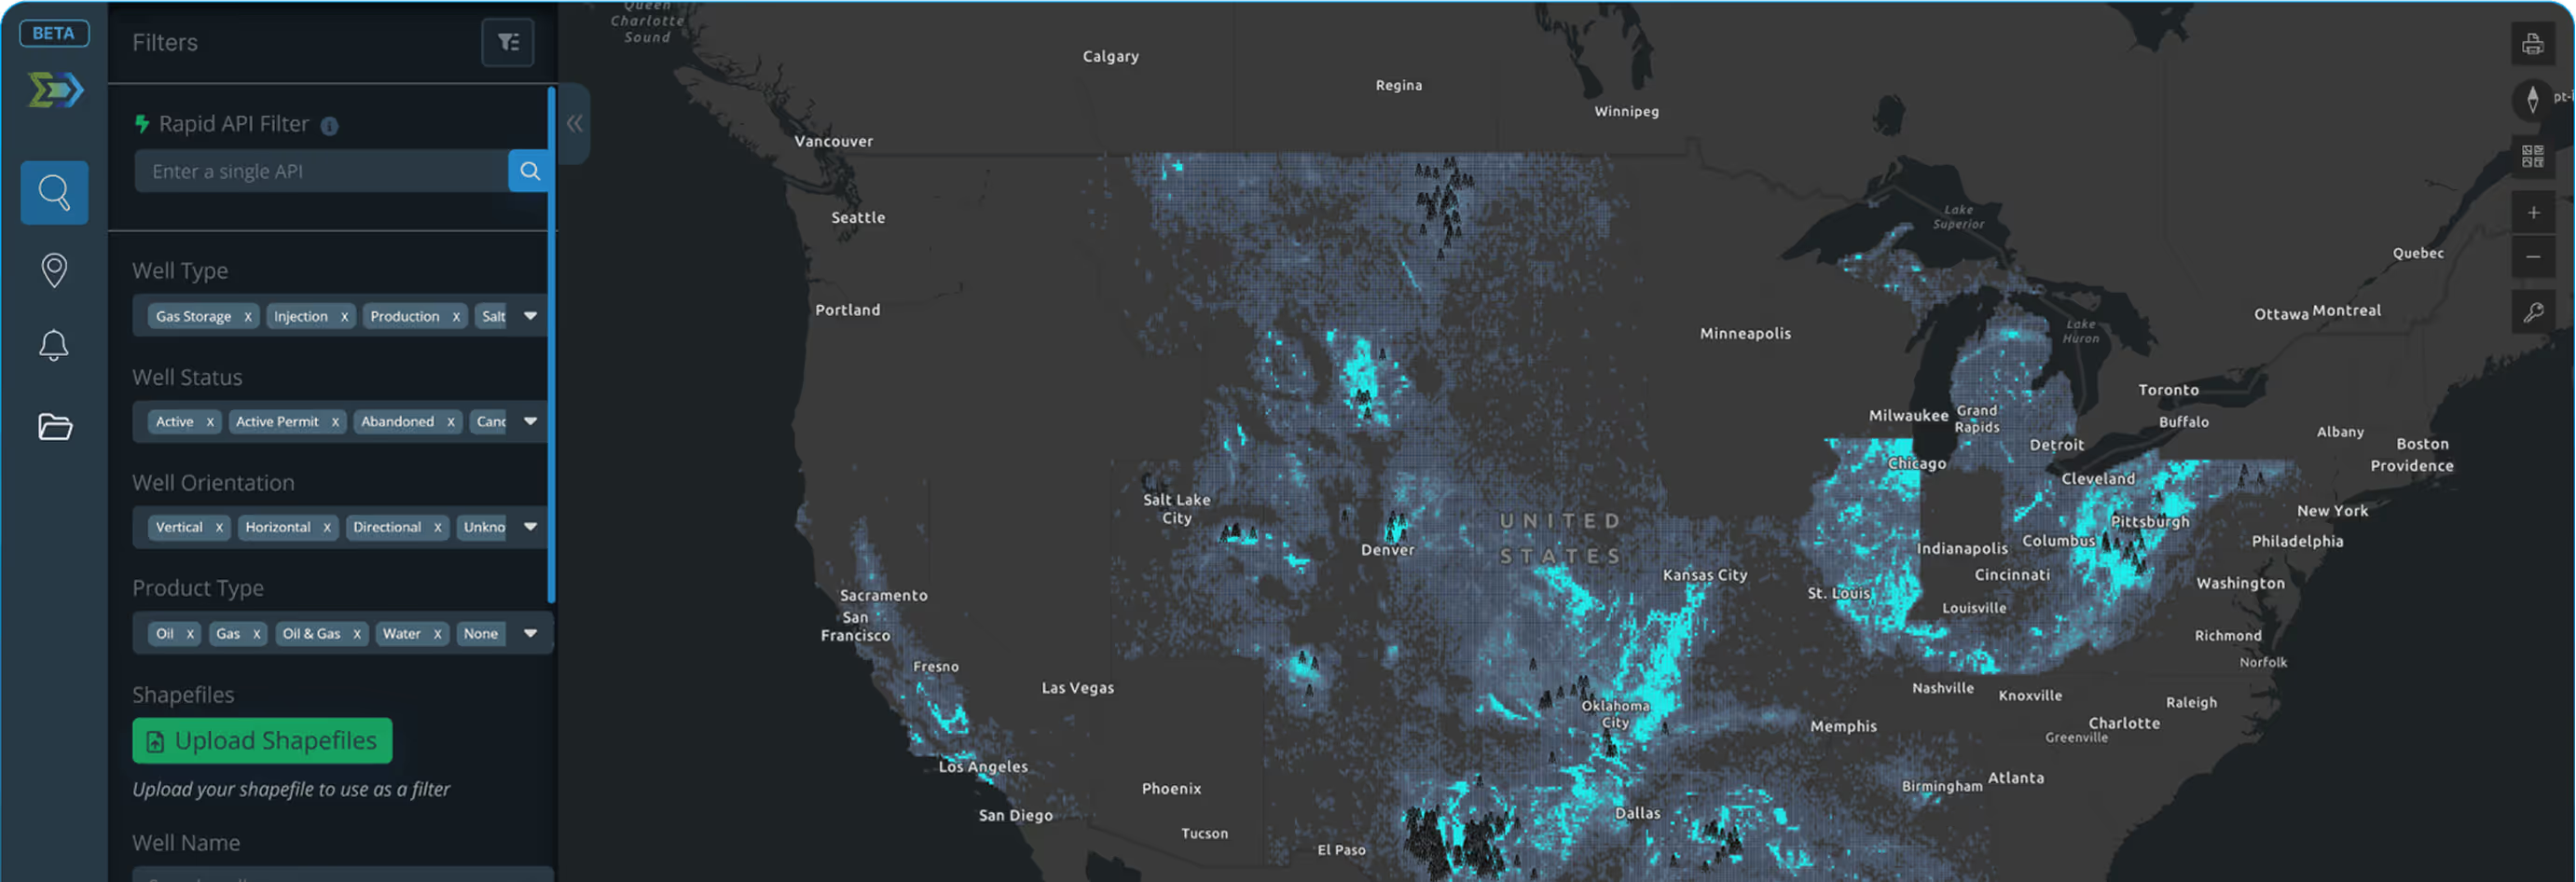
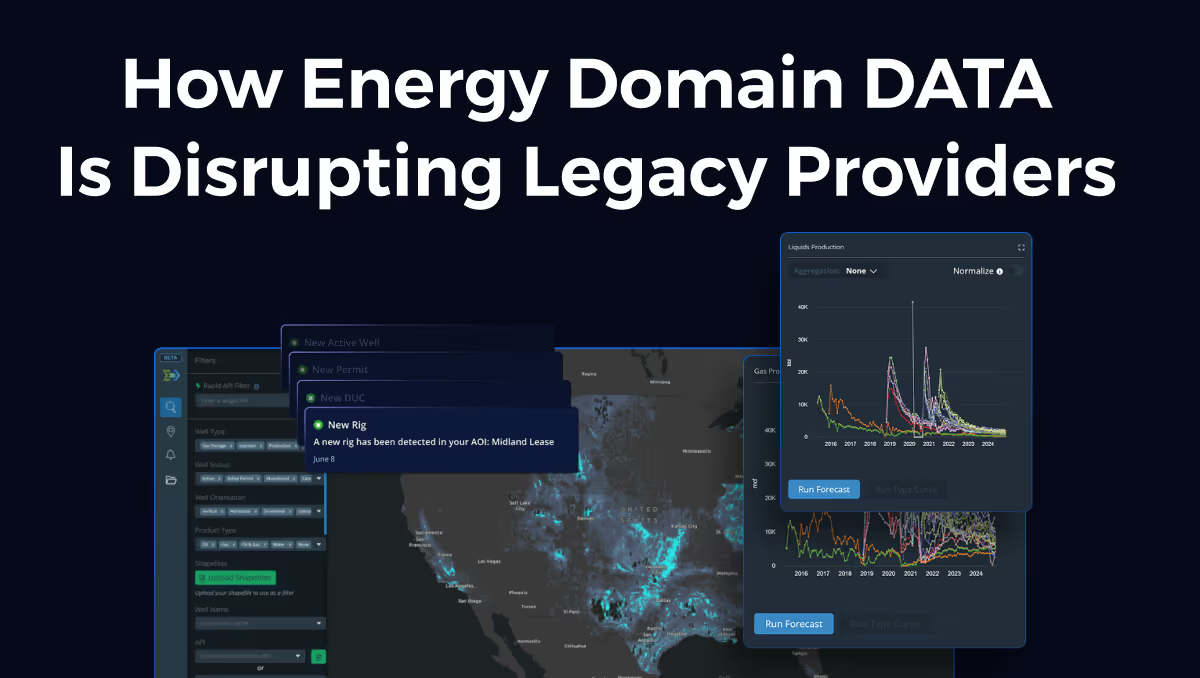
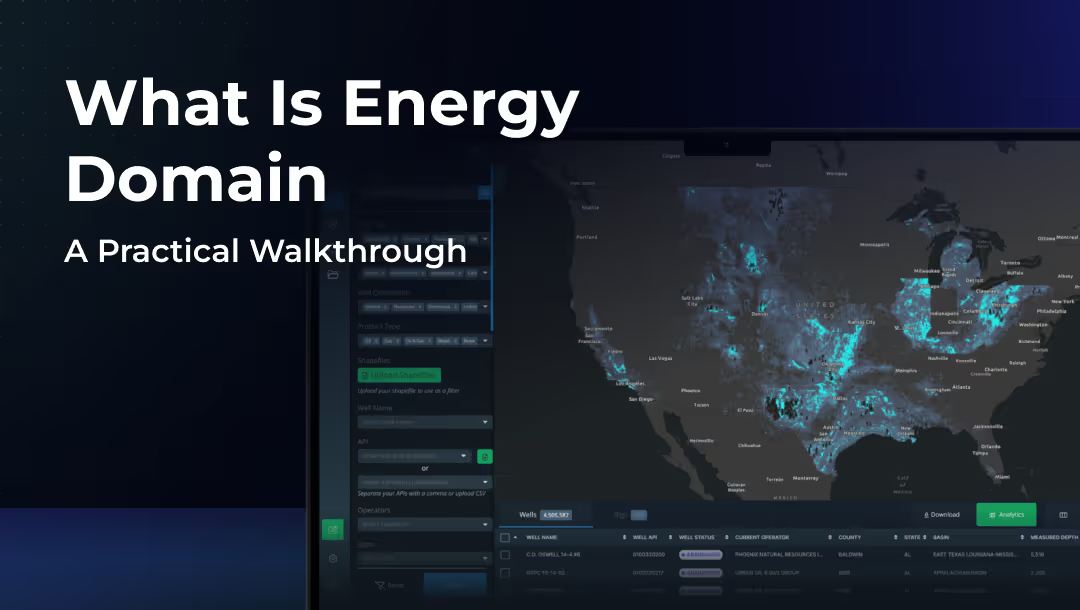
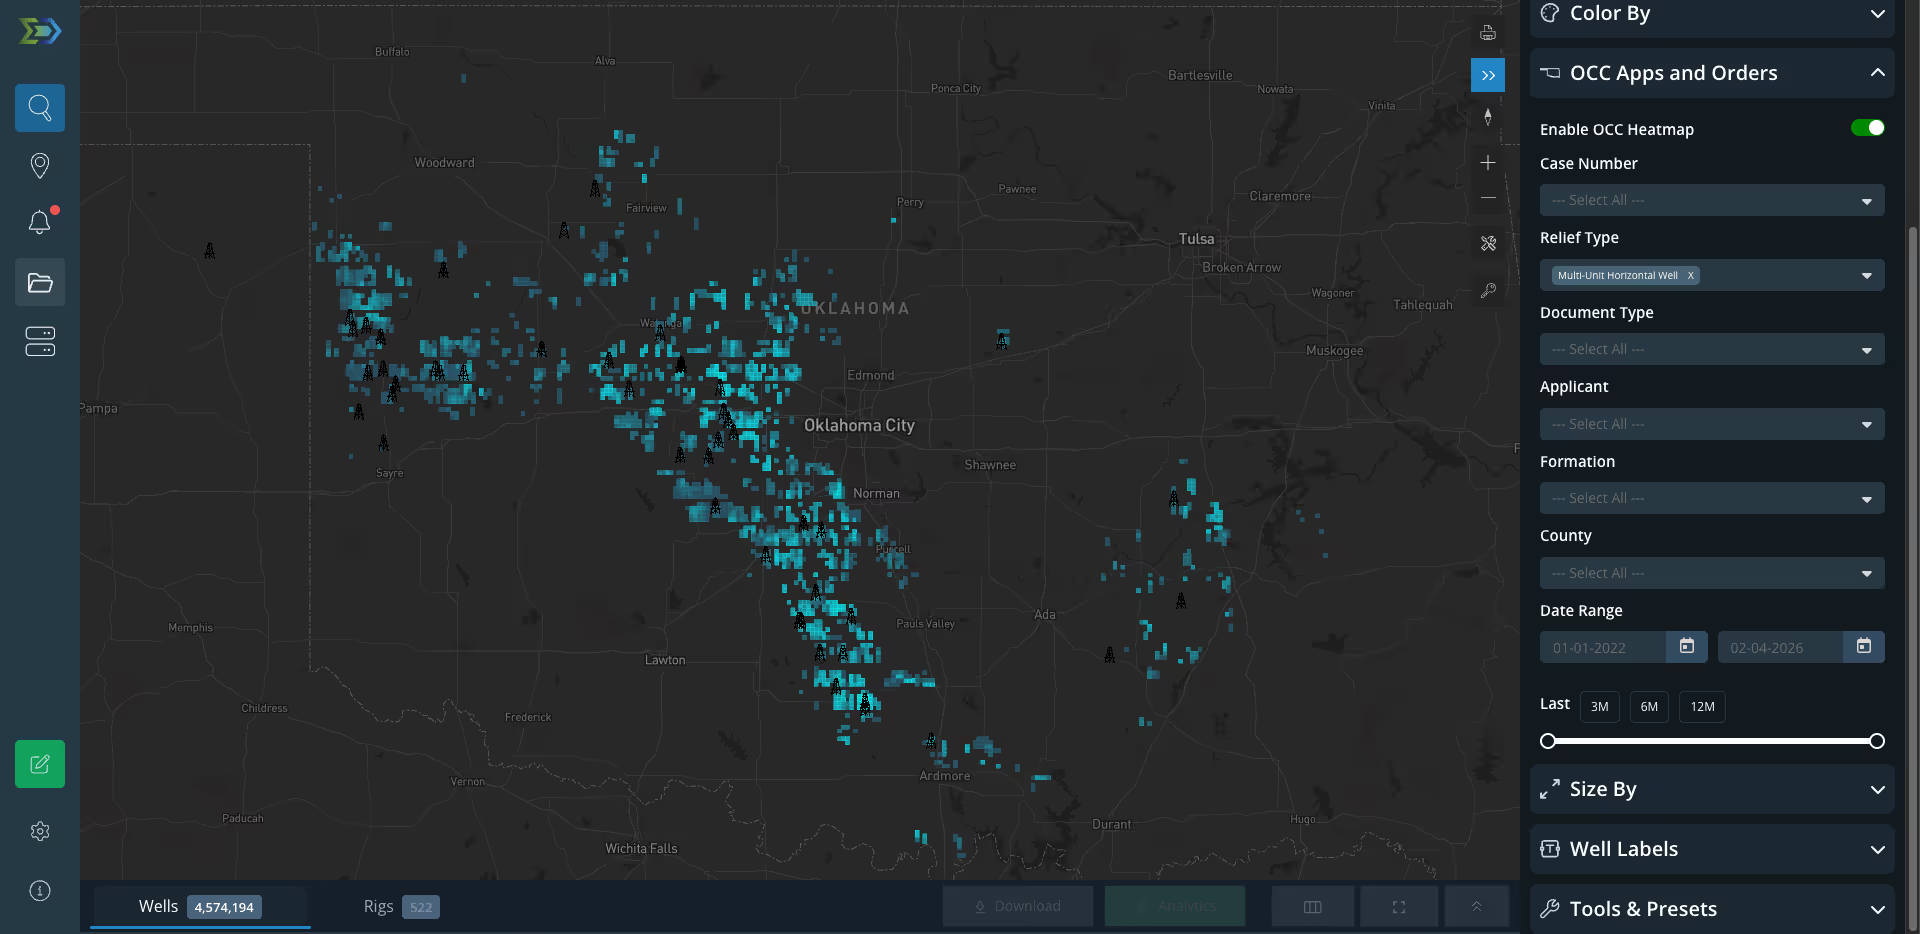
Rig data integrates directly into the Energy Domain map. Rig positions are displayed alongside well headers, directional surveys, permits, and production data — all in a single spatial view. Filter by operator, basin, or area of interest to focus on the activity that matters to your workflow.

Applications

Monitor competitive drilling activity in your areas of interest. Know when a neighboring operator spuds a well before it shows up in permit records or production filings.
Evaluate development intensity on assets you’re underwriting. Active rigs signal near-term production additions that affect valuation and PUD assessment.
Track development timing without relying on operator communication or delayed regulatory filings.
Basin-level rig trends provide macro capital deployment intelligence. Track shifts in operator focus and validate portfolio exposure.

.png)














© 2026 Energy Domain · Fort Worth, TX