0 Results for ""

Well-level production you can defend
State agencies report production at the lease level. Operators and acquirers need well-level estimates to make capital decisions. Our allocation methodology transforms commingled lease totals into defensible well-level production using volume conservation, empirical well test data, and state-appropriate methods.
Trusted by operators, non-op buyers, mineral aggregators, and A&D advisors across the upstream market.






From Lease Totals to Well-Level Intelligence
In Texas and Louisiana, oil and gas production is frequently reported at the lease level rather than by individual wells. When multiple wells produce from a single lease, their volumes are commingled and measured at a common point. This simplifies field operations and regulatory reporting, but it creates a significant analytical gap.
Engineers need well-level data for type curve analysis, decline curve forecasting, reserves estimation, and performance comparisons. Acquirers need it for defensible PDP valuation. The question is straightforward: given a known lease total for a month, how do you determine each well’s contribution when those contributions were never measured separately?
The answer lies in well test data — periodic measurements that capture individual well performance and provide evidence of each well’s relative production potential.
Core Allocation Principles
Our methodology combines regulatory data, well test measurements, and systematic algorithms to deliver reliable well-level estimates. Four principles govern every allocation.
Volume Conservation: The sum of all allocated well-level production always equals the original lease-level production. No volume is created or lost. If a lease reports 10,000 barrels in a month, allocated production across all wells sums to exactly 10,000 barrels. Any discrepancy immediately signals a data inconsistency requiring investigation.
Test-Based Allocation: Well tests provide empirical snapshots of individual well performance under controlled conditions. When test data shows Well A at 200 BOPD and Well B at 100 BOPD, we have direct evidence that Well A likely contributes approximately twice as much to the lease total. Tests form the evidentiary foundation — not models, not assumptions.
Temporal Interpolation: Tests occur at discrete points. Production happens continuously. We use linear interpolation between test measurements to create continuous type curves that estimate each well’s production potential throughout its producing life. Louisiana’s quarterly tests span ~90-day gaps; Texas’s annual tests require interpolation across year-long periods.
State-Appropriate Methods: Texas and Louisiana provide different types and quality of data. Louisiana offers explicit temporal records from state production grouping. Texas lacks explicit well-to-lease dates, requiring our Well Date Finder algorithm to synthesize information from multiple sources and correlate production peaks with completion timing.
Single-Well Leases: All production assigned directly to the single well. No type curves, interpolation, or proportional distribution needed. Highest confidence scenario.
No Test Data Available: Allocation cannot proceed without test evidence. Production remains at the lease level.
Data Inconsistencies: When temporal data is missing or logically inconsistent, allocation is skipped. These leases are flagged for data review.
Water Production: Estimated using ratio-based methodology. Water-to-oil and water-to-gas ratios from well tests are applied to allocated hydrocarbon volumes. No volume conservation check is possible.
Understanding Allocation Confidence
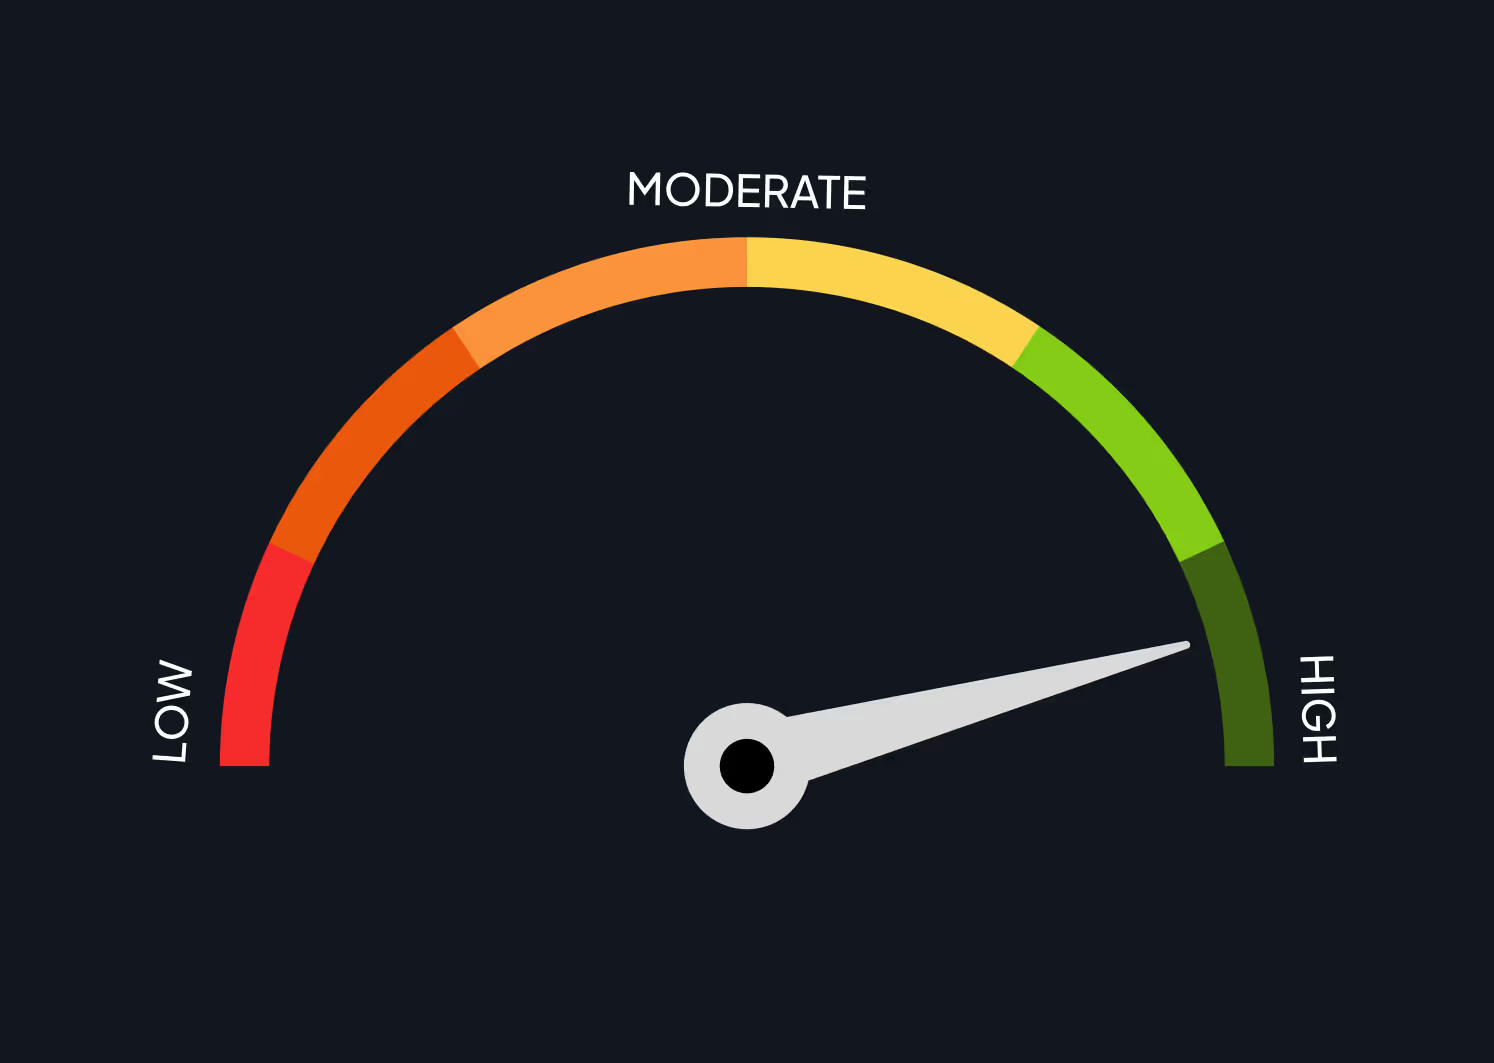
High Confidence: Single-well leases. Multi-well leases with frequent tests, clear temporal boundaries, and stable production. Louisiana leases with comprehensive quarterly testing.
Moderate Confidence: Texas leases with clear production patterns and annual test data. Wells with consistent performance where interpolation across 12-month gaps remains reasonable.
Lower Confidence: Very infrequent tests exceeding one year gaps. Texas leases with ambiguous production peaks. Active drilling periods with rapidly changing lease composition.
Allocations are living estimates. As new well tests arrive and production history matures, allocations are re-run. The most recent run is always the best available.
Texas Oil Leases: Dual-product allocation — separate runs for oil and casinghead gas production. Gas wells report by-well and do not require allocation.
Louisiana Oil & Gas Leases: Both oil and gas leases require allocation. Treated as distinct entities with product-specific test values.
Water Production: Estimated using ratio-based methodology applied to allocated hydrocarbon volumes. Useful for trend analysis but carries higher uncertainty.


Texas vs. Louisiana
Once temporal boundaries are established, both states proceed through identical allocation steps. The core methodology is robust across both contexts. Only the input data sources differ.

Annual test frequency (~12 month intervals). No explicit well-to-lease dates — requires Well Date Finder algorithm. Gas wells report by-well; oil leases require dual-product allocation (oil + casinghead gas). Compounded uncertainty from annual interpolation and estimated temporal boundaries.
Quarterly test frequency (~3 month intervals). Explicit temporal boundaries from state production grouping records. Both oil and gas leases require allocation. Higher baseline confidence with uncertainty limited primarily to interpolation between quarterly tests.
How Allocation Works, Step by Step
Step 1
Step 1 — Estimate Temporal Boundaries (Texas Only)
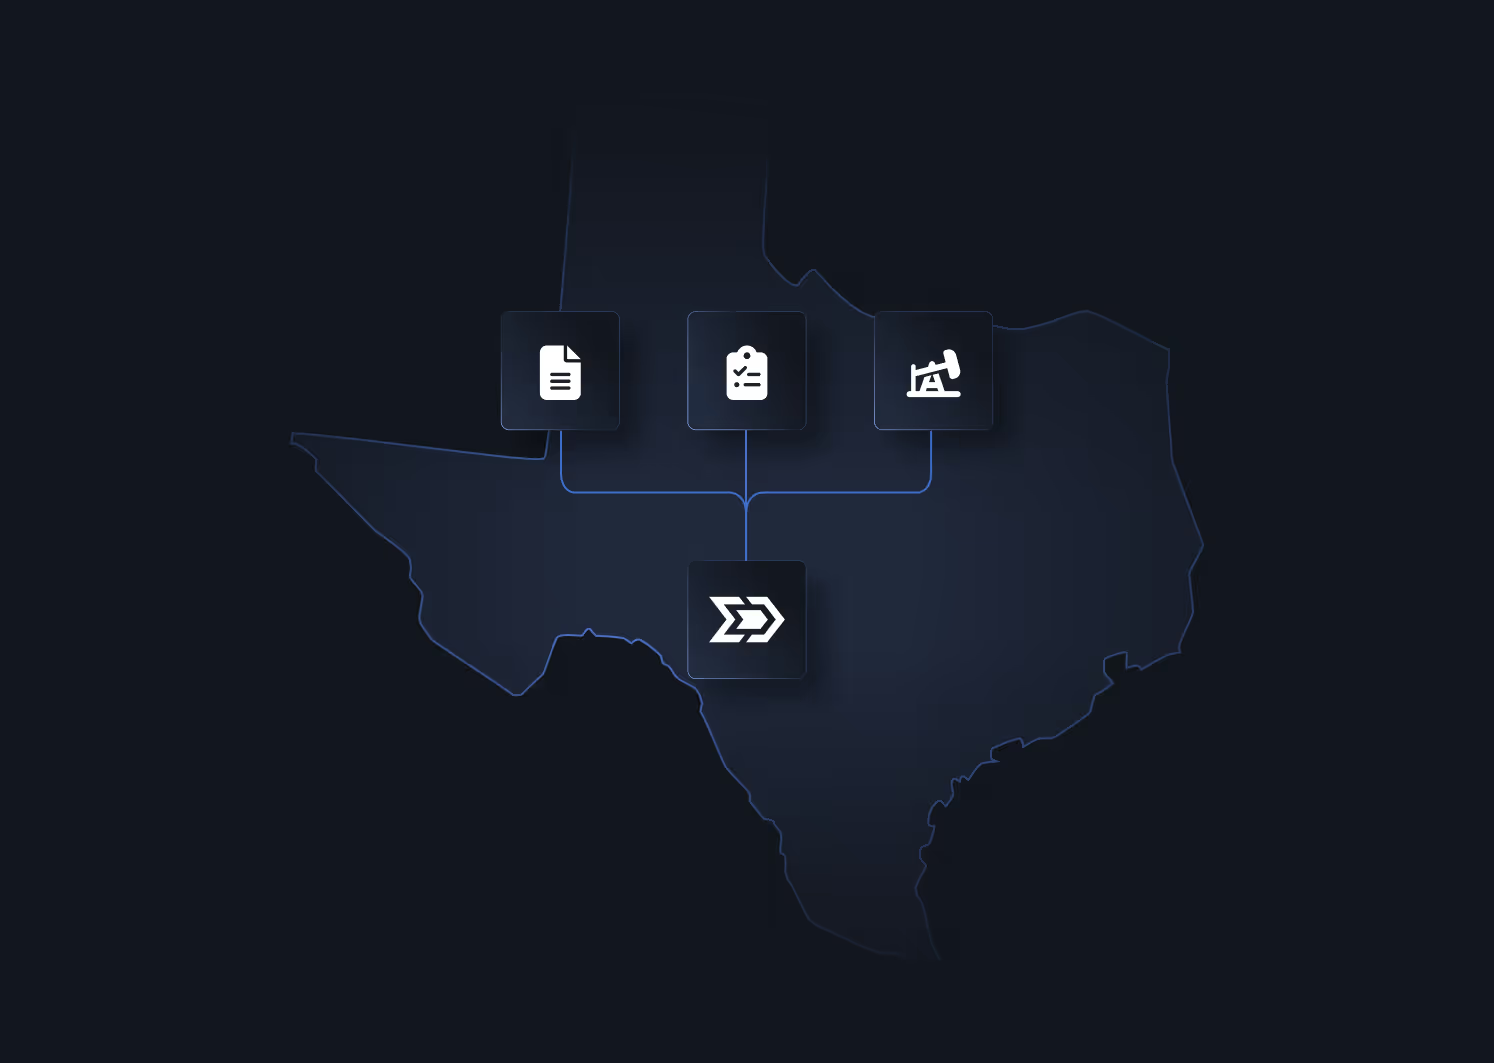
The Well Date Finder algorithm establishes when each well began and ended production on its lease. It synthesizes completion records, permit data, and production pattern analysis to determine when wells were added to or removed from active production. Louisiana’s explicit state records make this step unnecessary.
Step 2
Step 2 — Build Type Curves from Well Tests
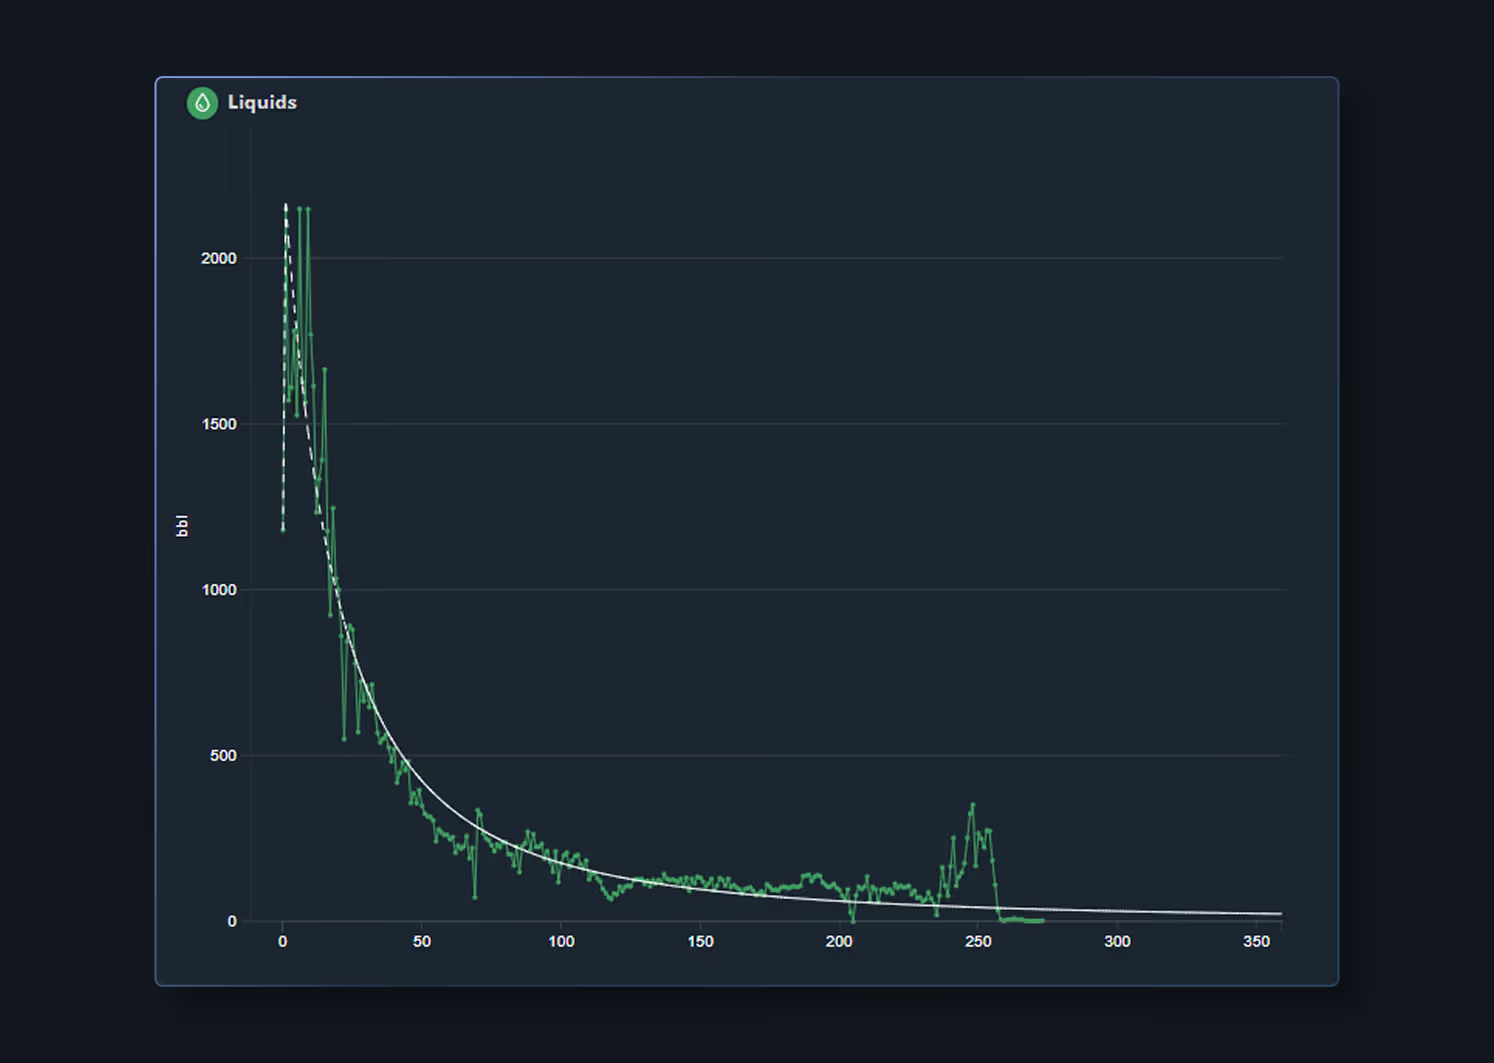
For each well, test measurements are ordered chronologically and connected through linear interpolation to create a continuous type curve. The first test value is extrapolated backward to the well’s start date; the last test is extrapolated forward to the end date.
Step 3
Step 3 — Calculate Allocation Factors
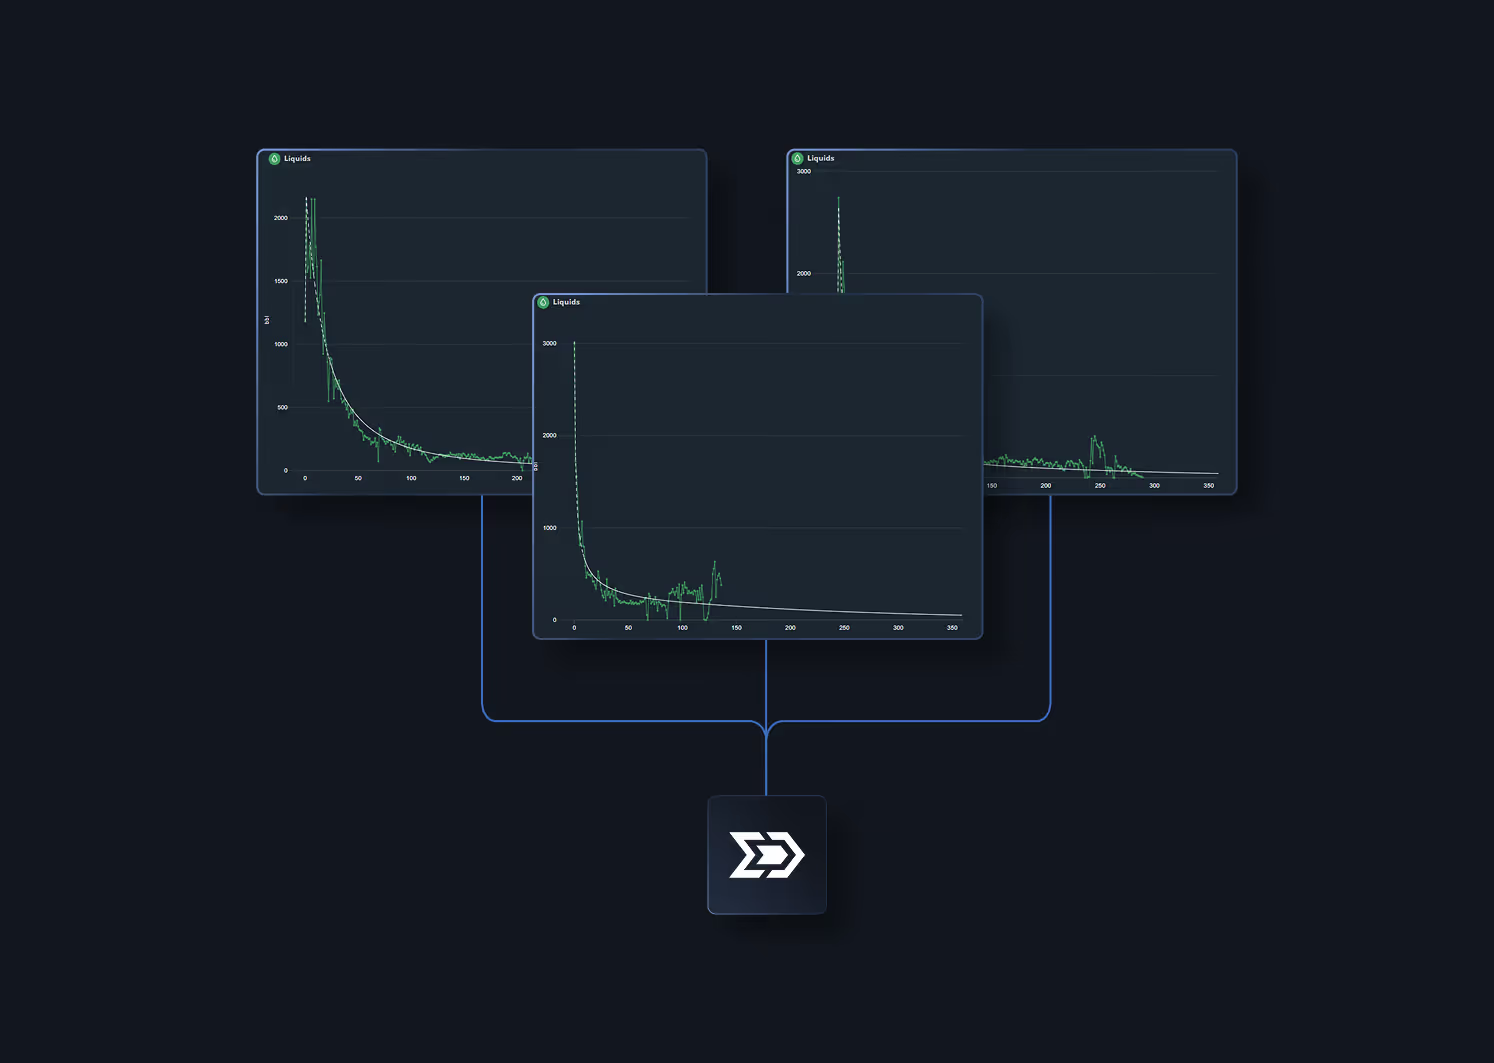
For each month, type curve values are summed across all wells to determine total estimated production potential. Each well’s allocation factor is its type curve value divided by the total. A well with a factor of 0.40 is estimated to contribute 40% of the lease’s production potential that month.
Step 4
Step 4 — Apply Factors to Lease Production
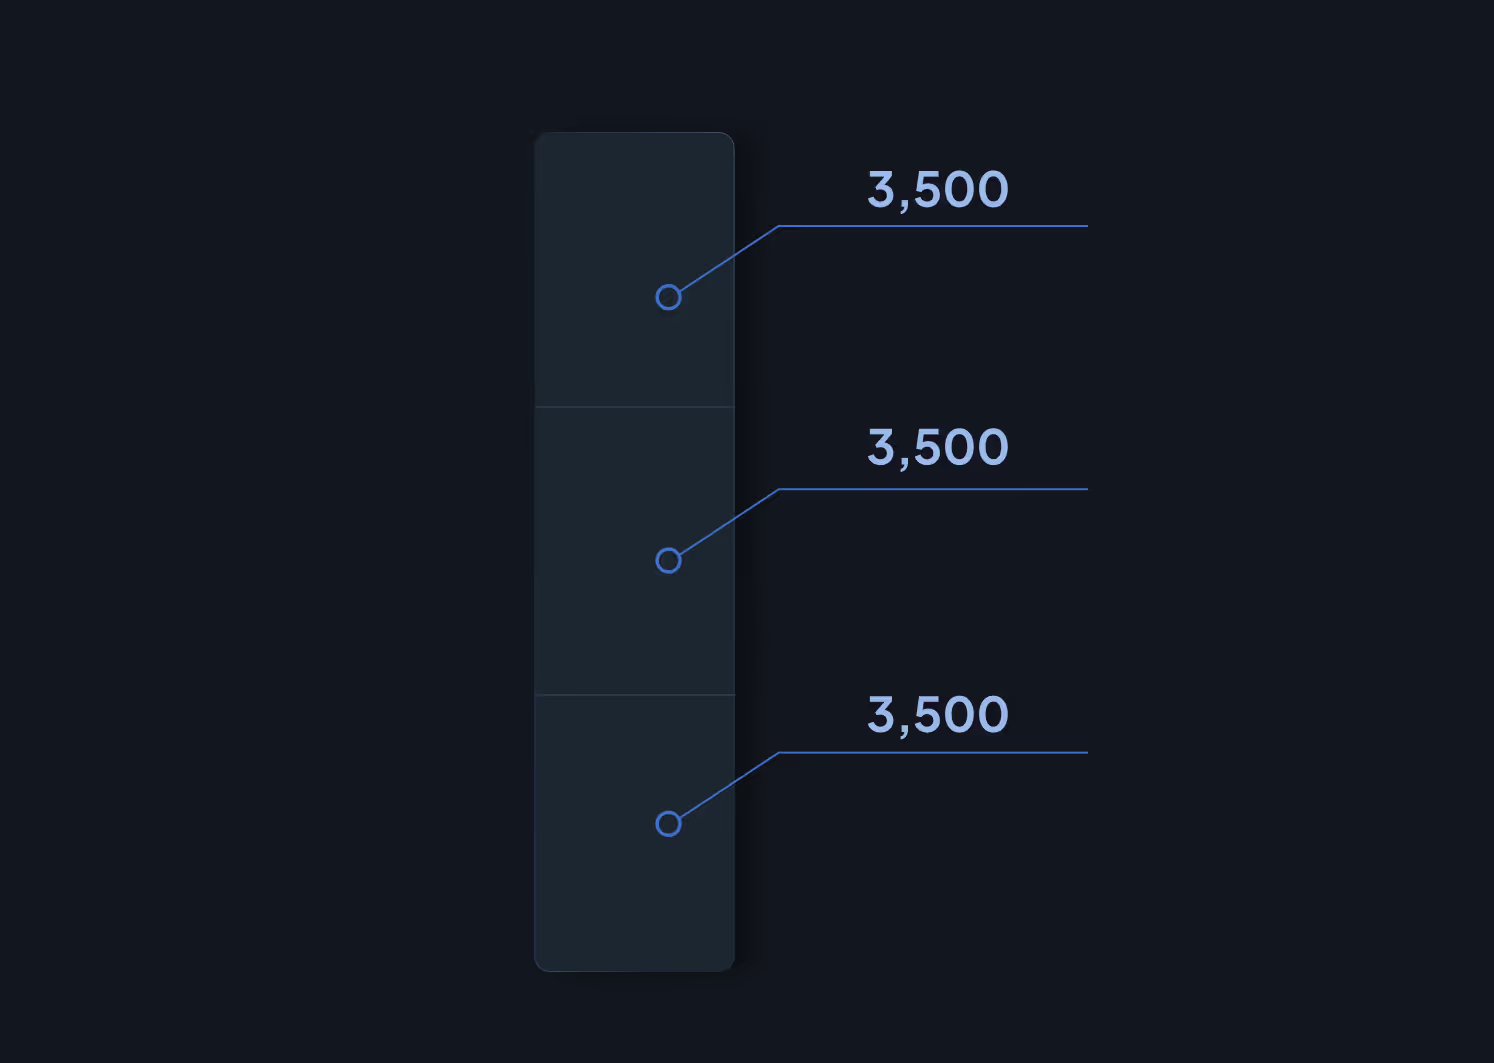
Allocation factors are applied to actual lease production. If a lease produced 10,000 barrels in March and a well’s factor is 0.35, that well receives 3,500 barrels of allocated production. Volume conservation is maintained — all allocated volumes sum precisely to the lease total.
Step 5
Step 5 — Continuous Recalibration
As new well tests arrive, operator production reports are updated, or regulatory records are refined, allocations are re-run. Historical values may be revised to reflect improved information. The most recent allocation run always represents the best available estimate based on current data.


.png)

















© 2026 Energy Domain · Fort Worth, TX