What's new in Analytics
Well count on its own axis
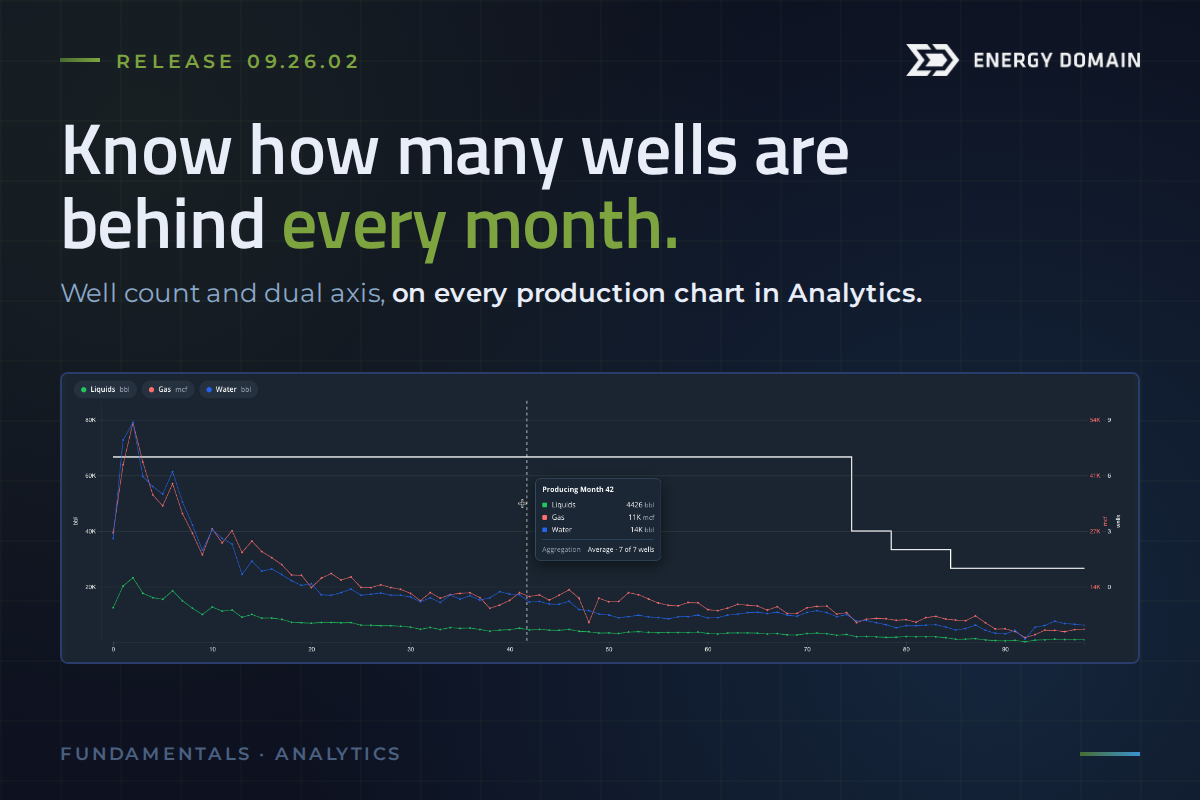
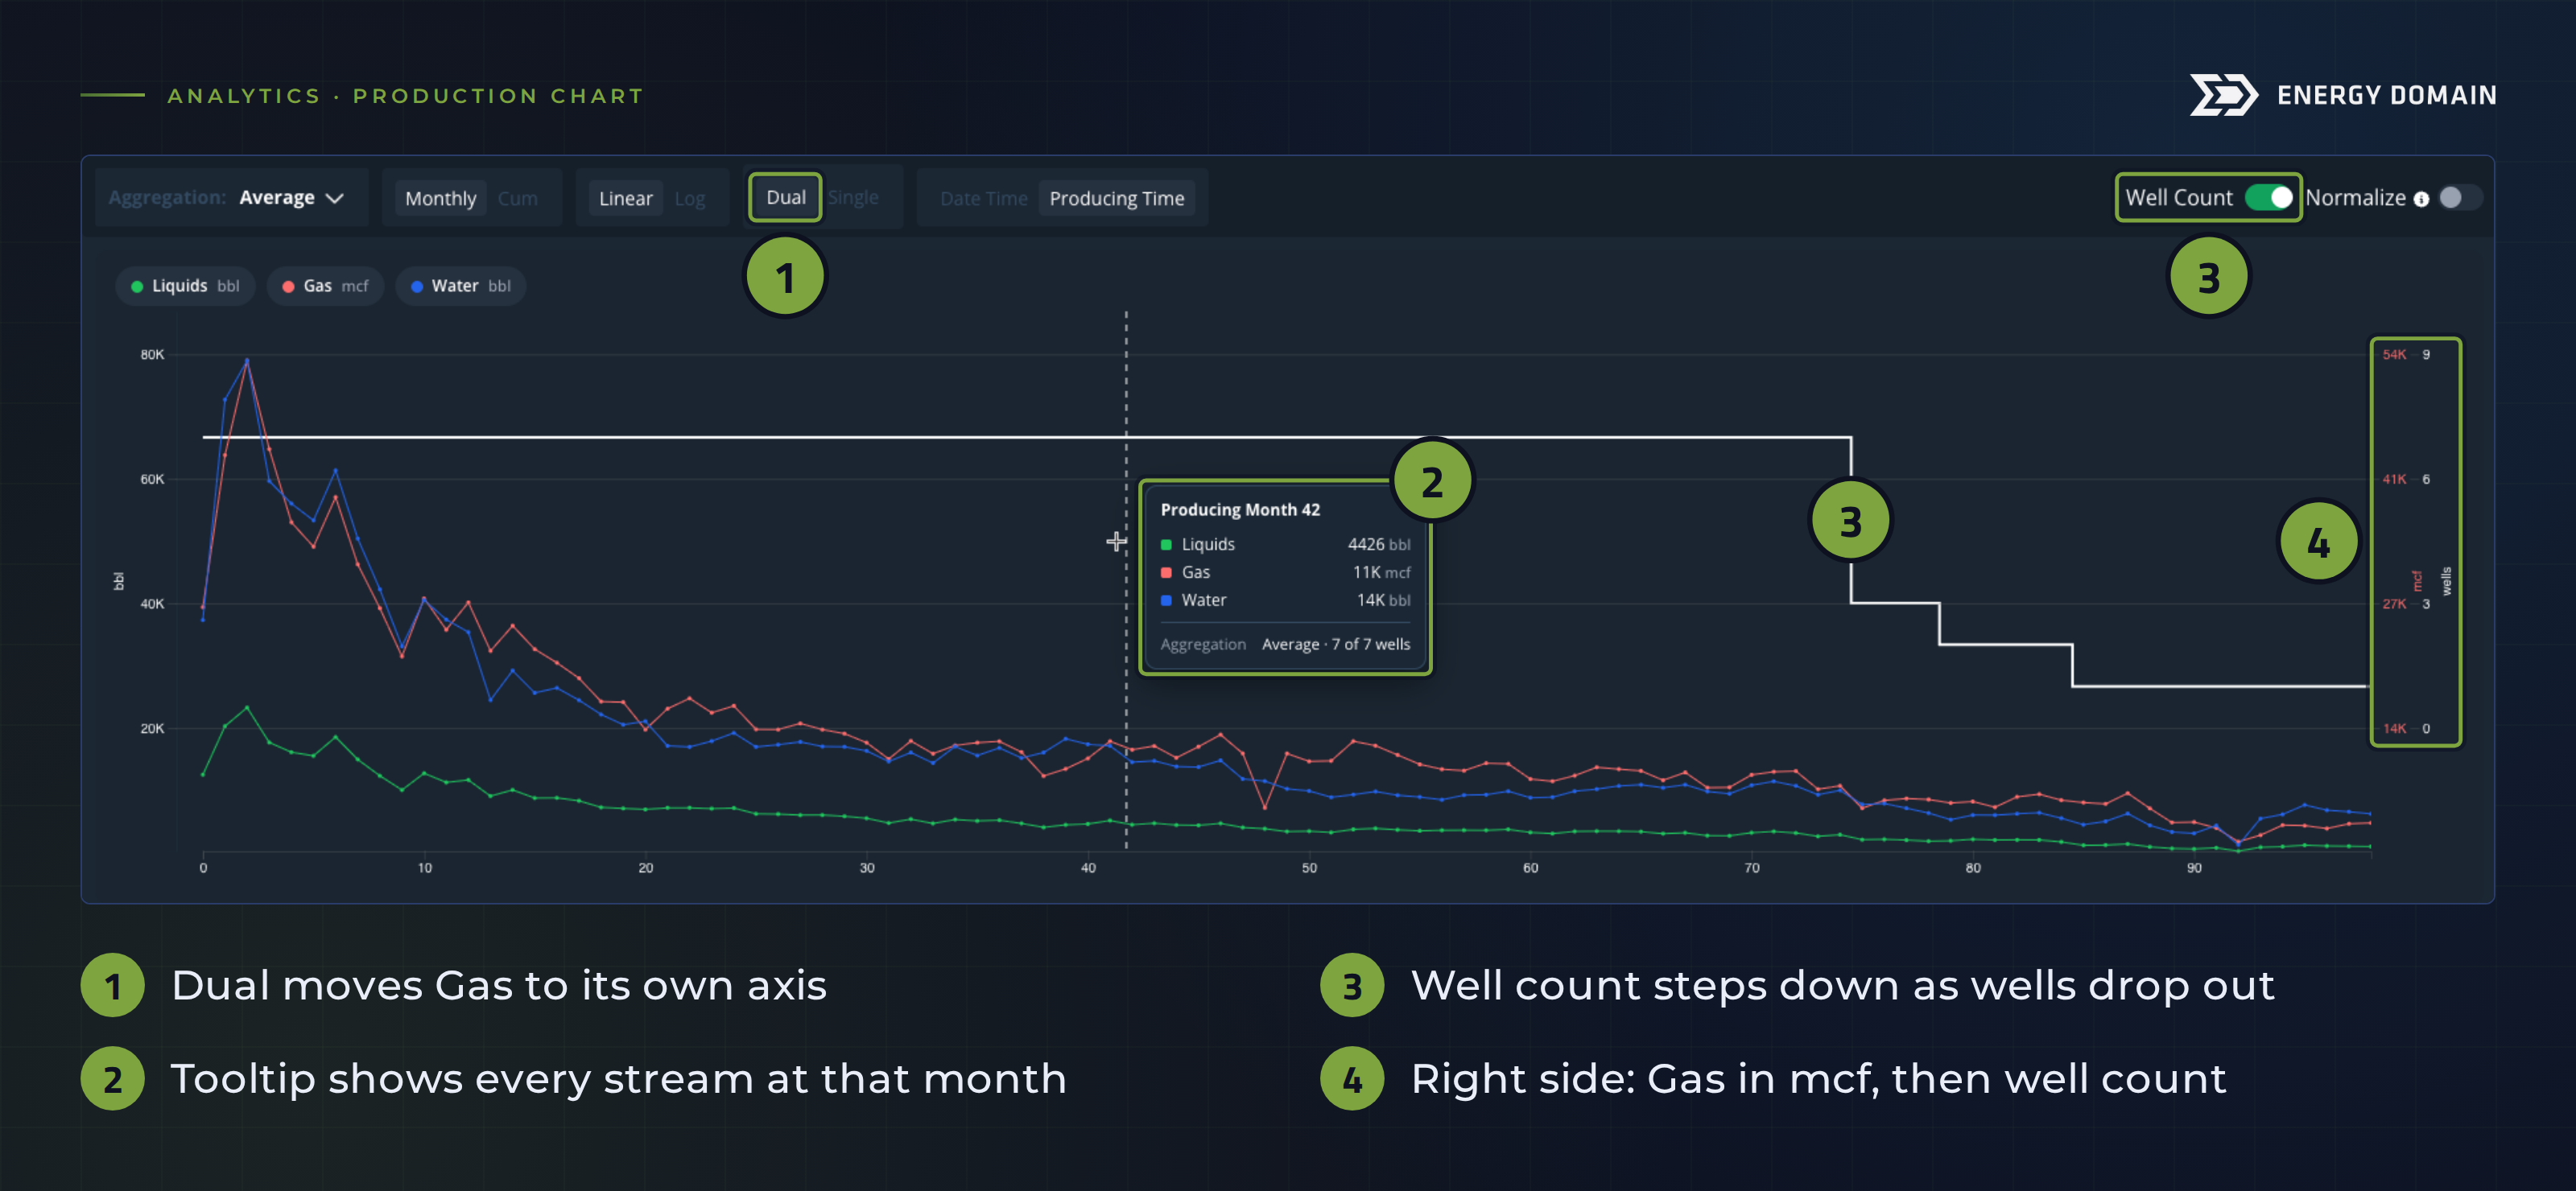
Turn on Well Count and the number of wells behind each month plots on its own axis. It runs the check above on every production chart in Analytics. Well count was a highly requested addition.
Every stream on one chart, with Gas on its own axis
Liquids, Gas, and Water now share one chart instead of separate ones. Gas volumes tend to dwarf the other streams, so turn on Dual and Gas moves to the right axis in mcf while Liquids and Water stay on the left in bbl.
Tooltips at every month
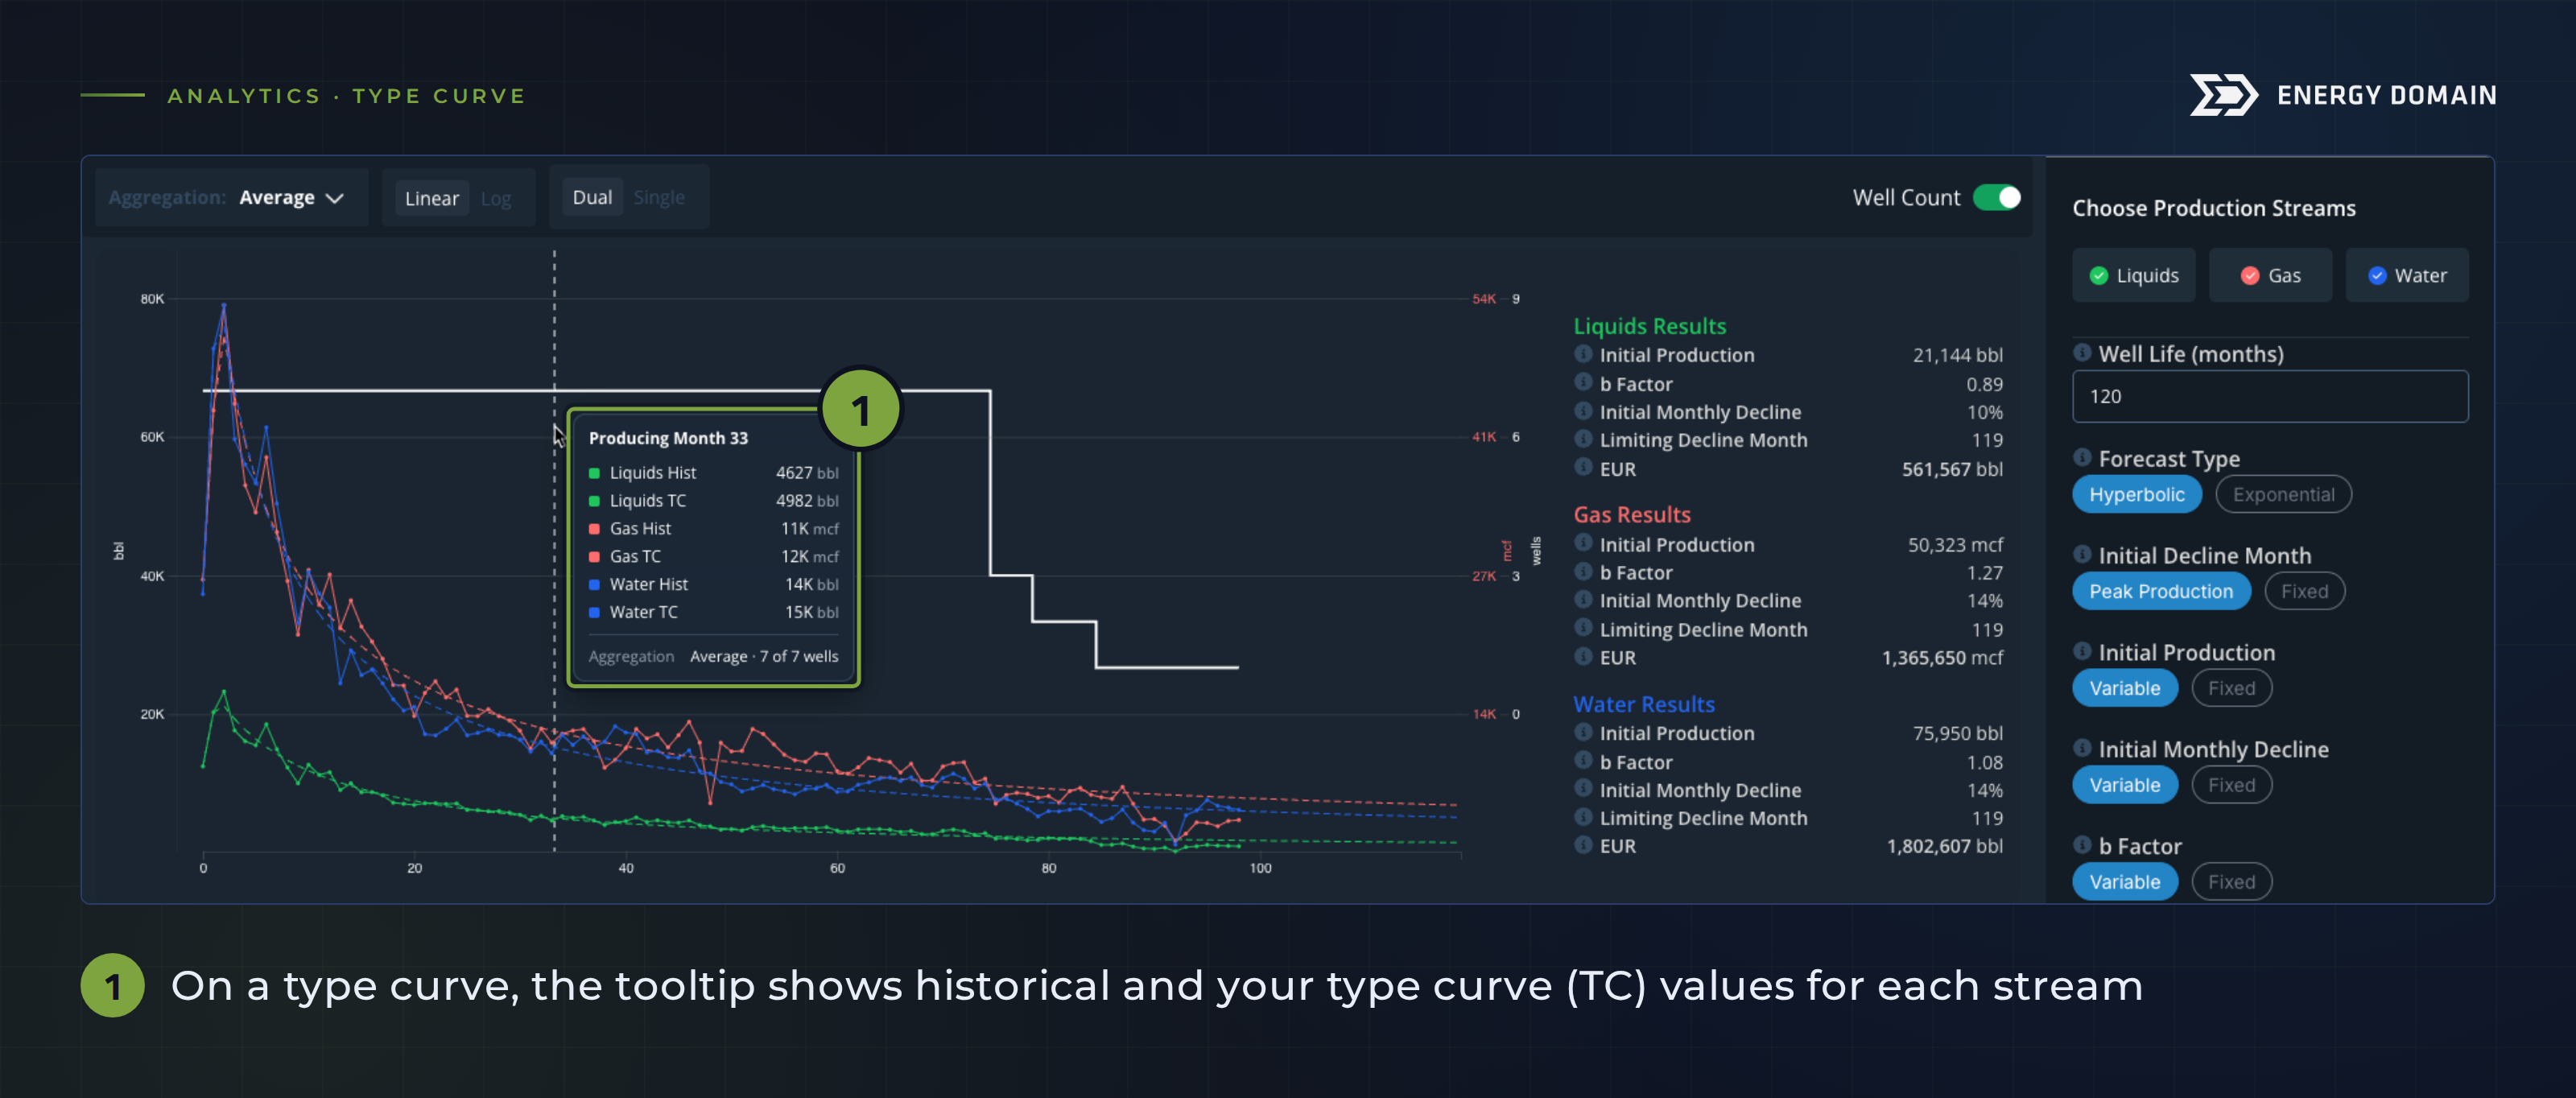
Hover over any month for each stream's volume, the aggregation method, and how many wells it includes. On a type curve, the tooltip shows historical and type curve values side by side, so you can see where your fit departs from the data at any month.
These changes apply to every production stream view in Analytics.
Run the check on your next cohort
- Build your cohort and open its production chart in Analytics.
- Set the x-axis to Producing Time so every well starts at month 0.
- Turn on Well Count and note the months where the line steps down.
- Hover on either side of each step to see how many wells are in the average.
- Where the tail rests on a few wells, check which ones are left (vintage, lateral length, landing zone) before you lean on the back half of the curve.
The same check works on a seller's type curve. Rebuild the cohort from the wells behind it and look at the well count past the first few years. If the tail comes down to two or three older wells, ask the seller how they extended it.
Also in release 09.26.02
AOIs and Shapefiles: Off, Partial, Full
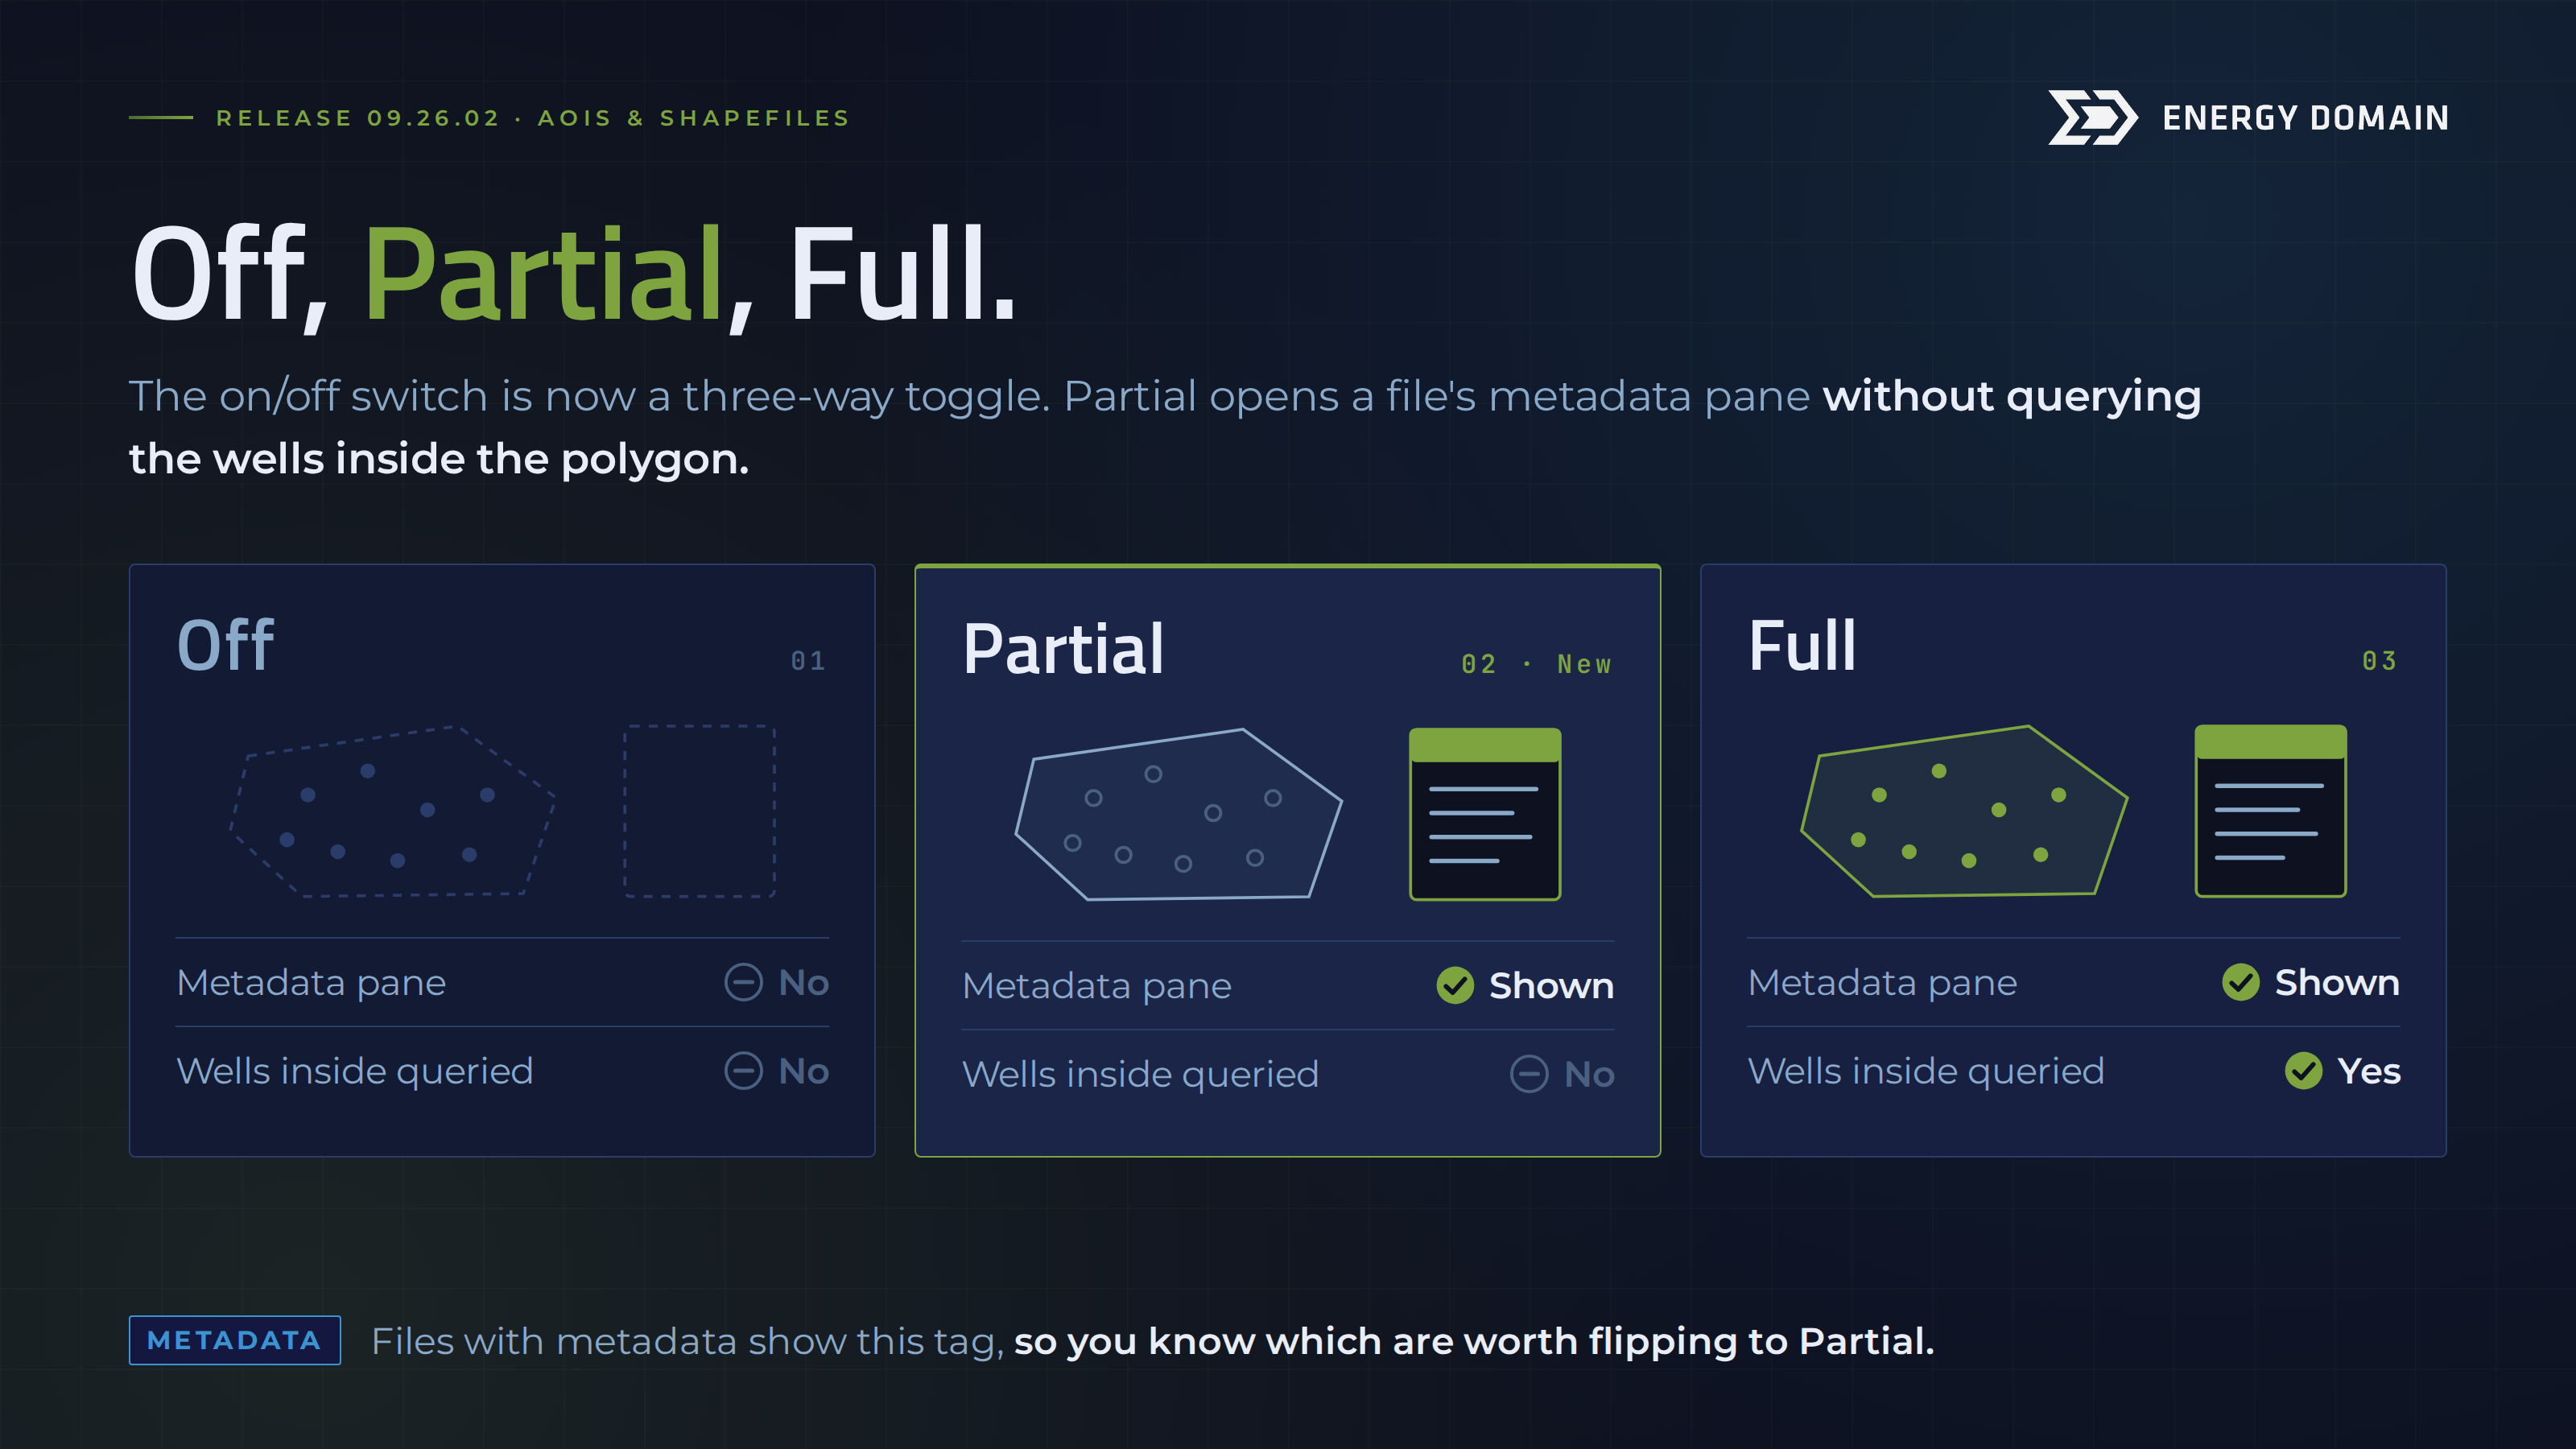
The on/off switch for areas of interest (AOIs) and Shapefiles is now a three-way toggle.
- Off is off.
- Partial opens the metadata pane for the file without querying the wells inside it.
- Full opens the metadata pane and queries the wells inside the polygon.
Partial is for the times you only need a file's metadata, like the attributes on a seller's shapefile, without waiting on a query of every well inside it. Any AOI or Shapefile with metadata attached shows a small Metadata tag in the file list, so you know which ones are worth flipping to Partial.
Sortable production cards
Production card data is now sortable. When you're viewing Well Production or Lease Production, you can re-sort the data on the fly.
More OCC data for Oklahoma
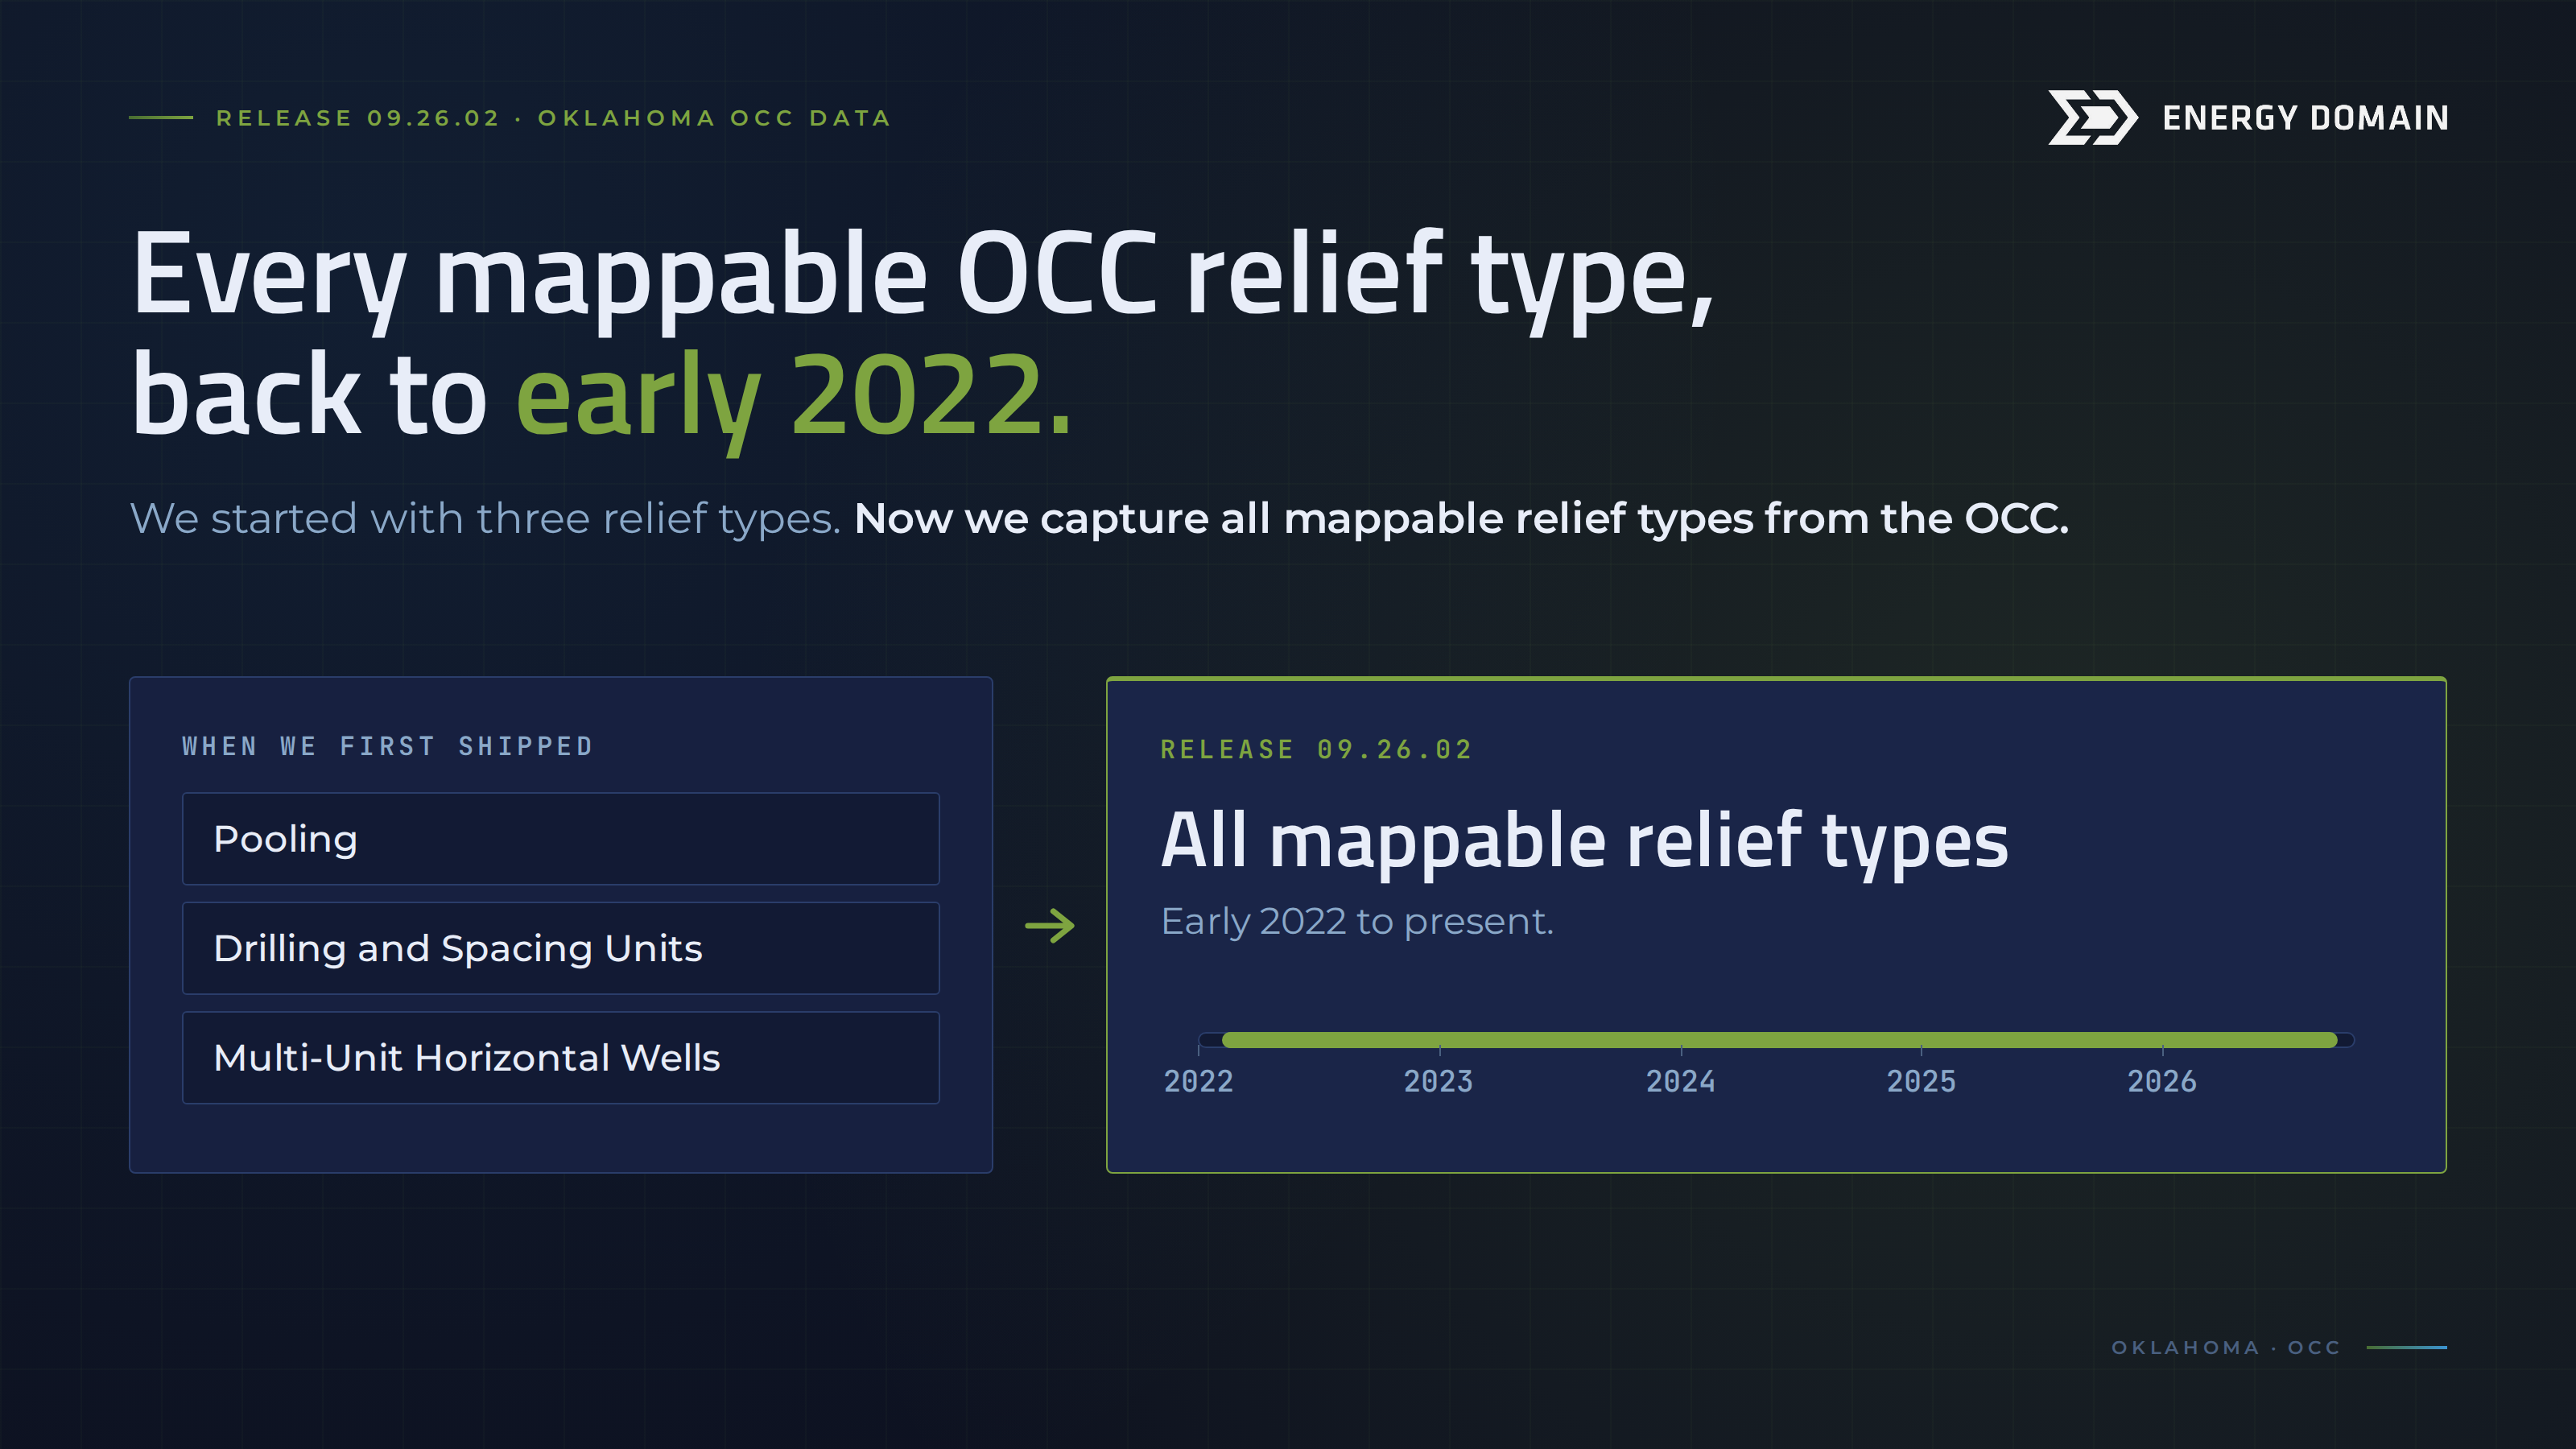
When we first shipped Oklahoma Corporation Commission (OCC) data, it covered Pooling, Drilling and Spacing Units, and Multi-Unit Horizontal Wells. We now capture all mappable relief types from the OCC, back to early 2022.
Appalachian Basin Fundamentals data
We've been working through West Virginia, Pennsylvania, and Ohio to fill gaps in core well data. Frac data now covers 88,257 wells, up from 19,081. We also acquired formation tops for more than 157,000 wells and casing data for more than 246,000.
For completions work, proppant type now covers 26% of Pennsylvania wells (up from 4%) and mesh size 17% (up from 1%). For structure and landing work in West Virginia, TVD now covers 80% of wells, up from 3%.
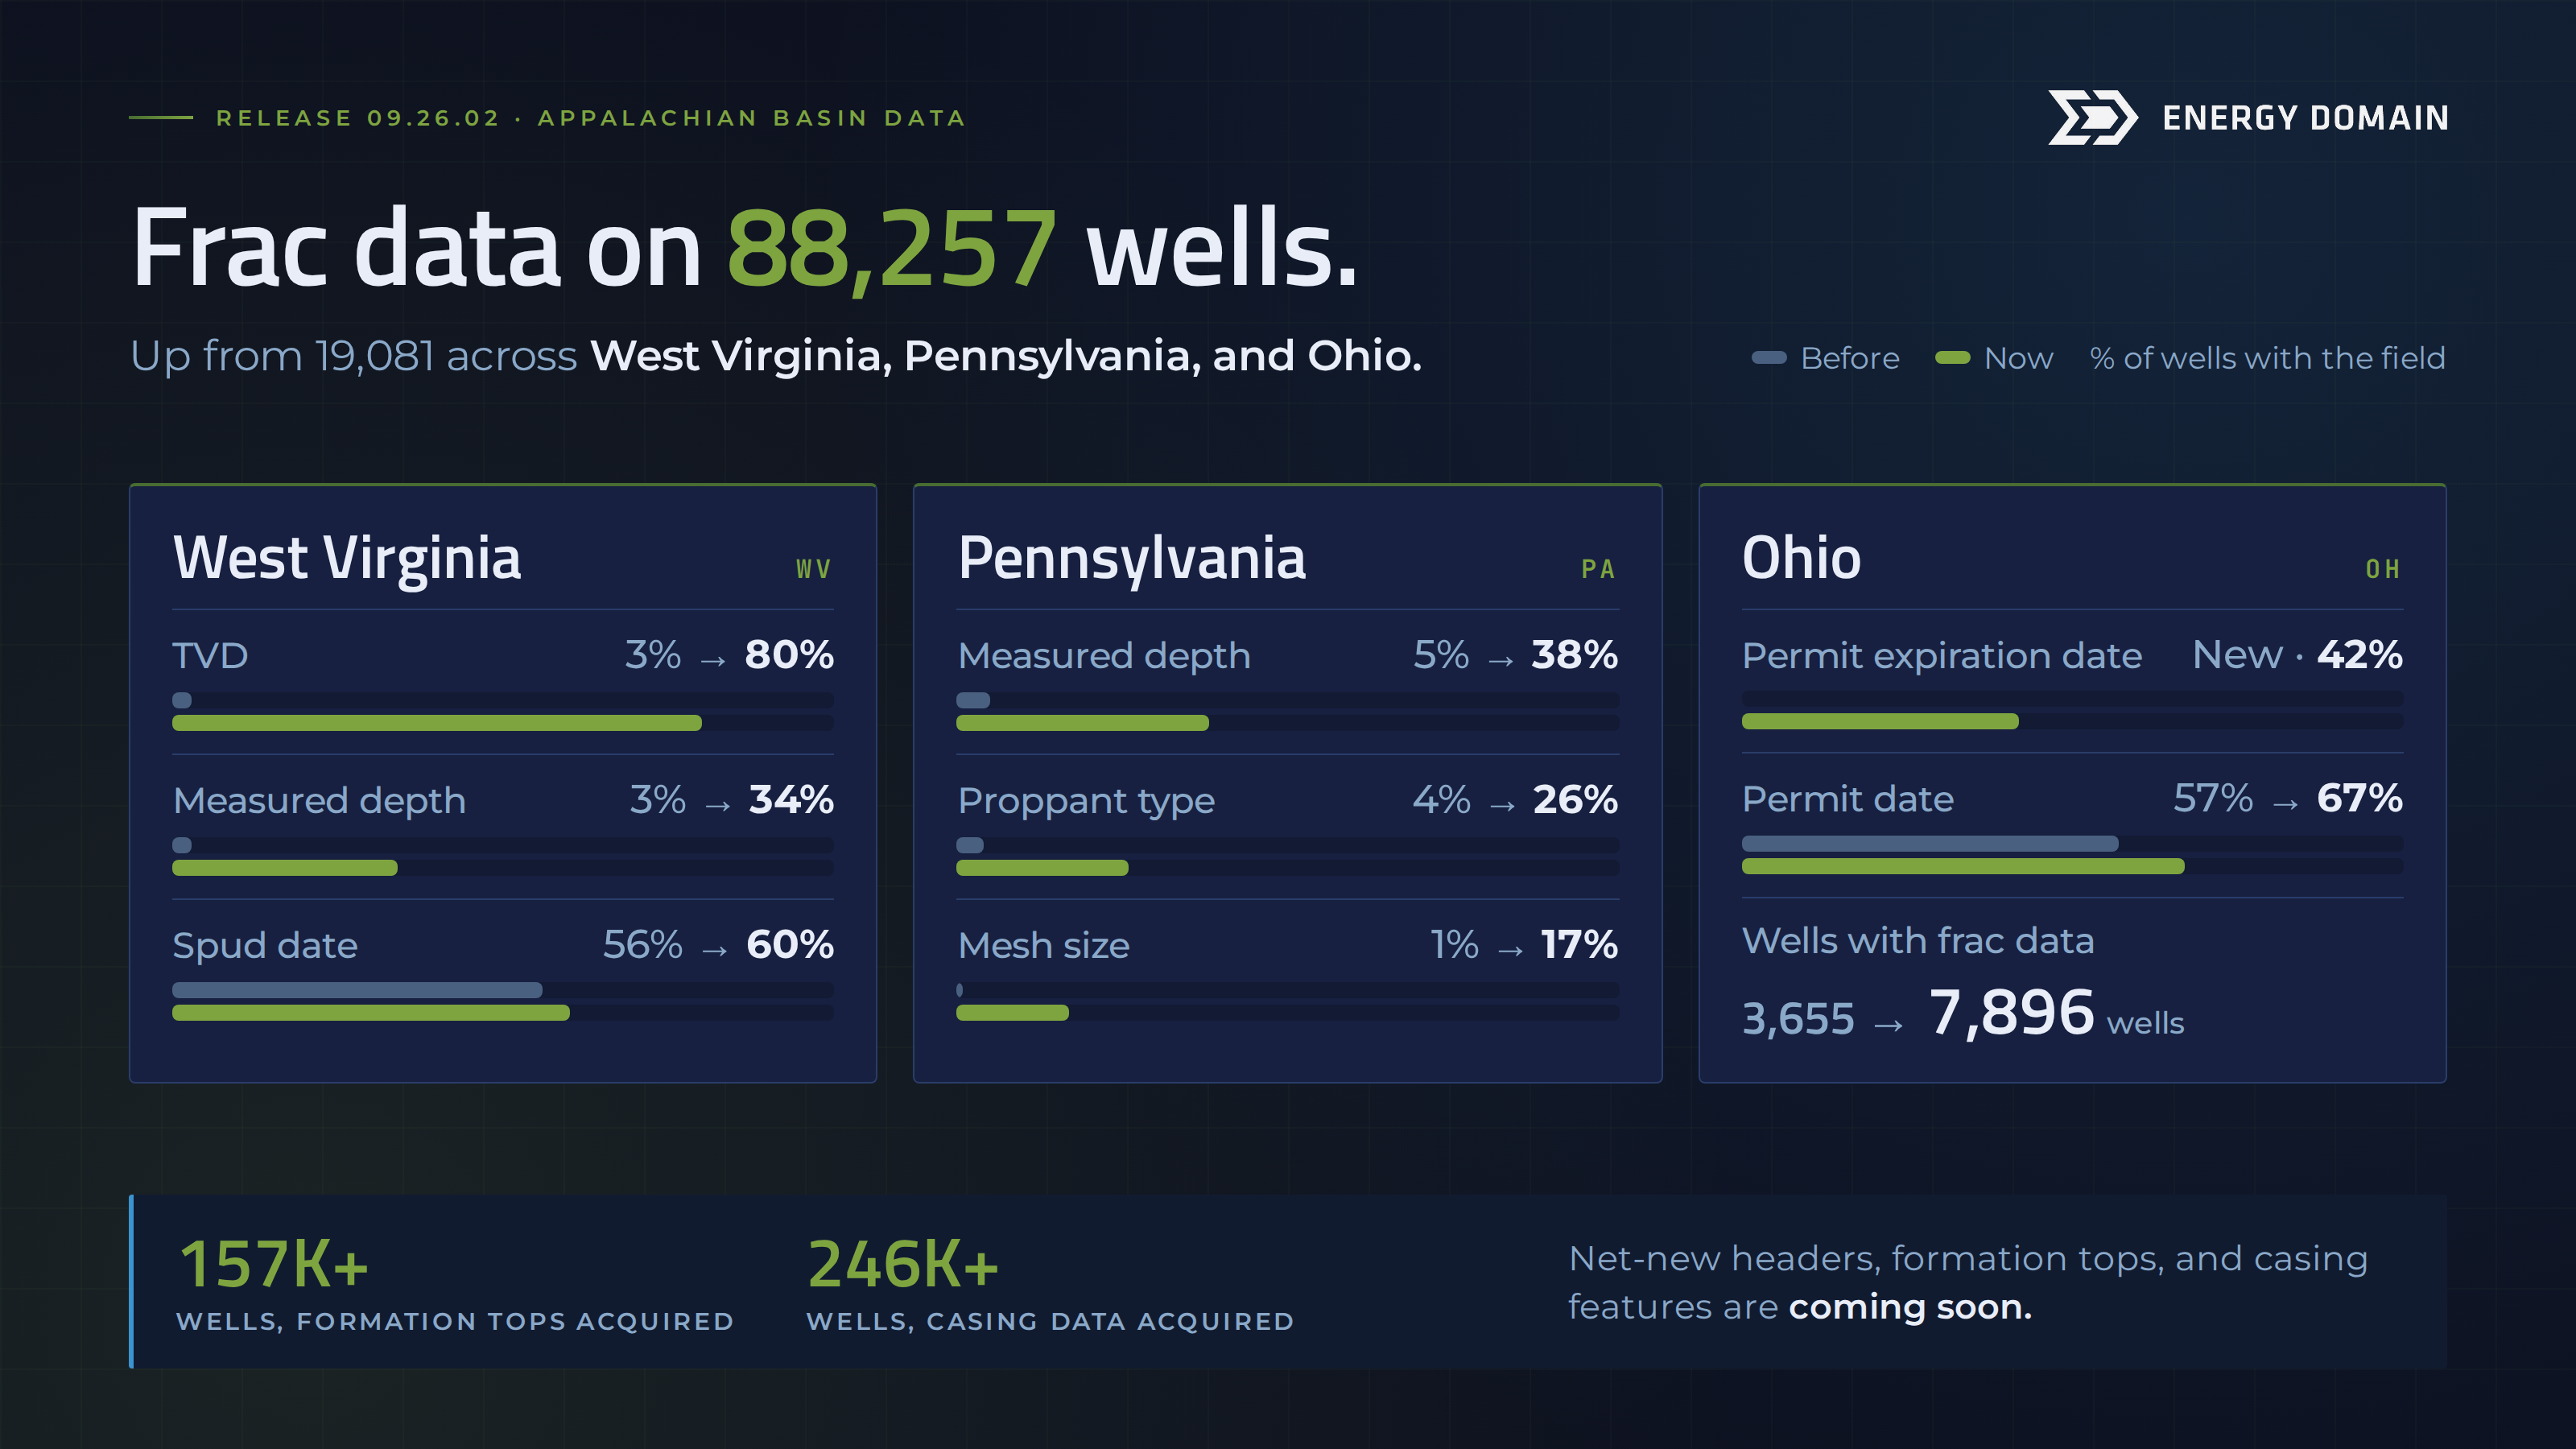
Net-new headers, formation tops, and casing features are coming soon.
Not on Fundamentals yet?. Get a demo
